NIFTY 50 (INDIA) indices Elliott Wave technical analysis [Video]
![NIFTY 50 (INDIA) indices Elliott Wave technical analysis [Video]](https://editorial.fxstreet.com/images/Markets/Equities/stock-market-research-9338010_XtraLarge.jpg)
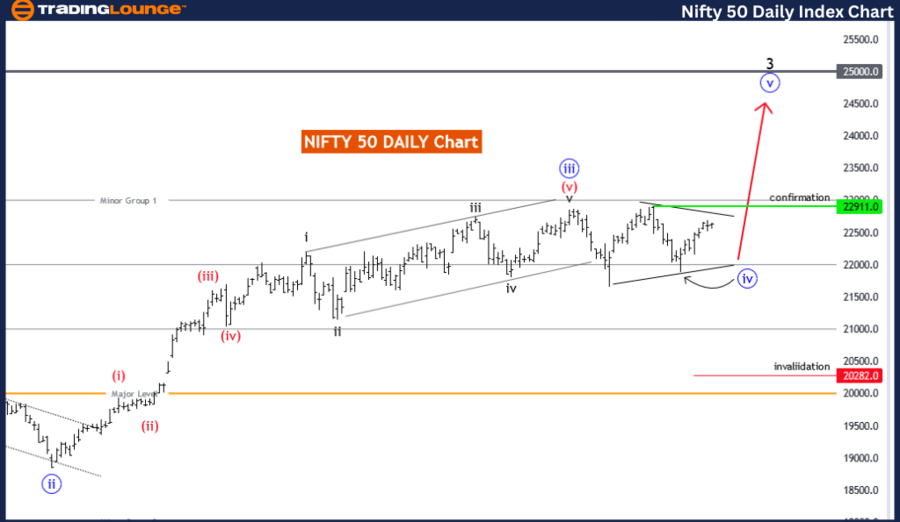
NIFTY 50(INDIA) Elliott Wave Analysis Trading Lounge Day Chart,
NIFTY 50 (INDIA) Elliott Wave technical analysis
Function: Trend.
Mode: Corrective.
Structure: Blue Wave 4.
Position: Black Wave 3.
Direction next higher degrees: Blue Wave 5.
Details: Blue Wave 3 looking completed.
Now blue wave 4 of 3 is in play or completed.
Wave Cancel invalid level: 20282.0.
The NIFTY 50 (India) Elliott Wave analysis on the daily chart provides a detailed overview of the market movements and the current phase within the Elliott Wave sequence. The primary function of this analysis is identified as a trend, indicating that the market is moving in a broader, long-term direction. The mode of the wave structure is classified as corrective, suggesting that the market is currently undergoing a retracement or consolidation within the larger trend.
The main structure identified in this analysis is blue wave 4, a significant phase in the Elliott Wave cycle that typically involves a corrective pattern following the impulsive movements of the previous waves. The current position within this structure is black wave 3, indicating that this phase is actively unfolding or nearing completion.
Looking ahead, the direction for the next higher degrees points towards blue wave 5. This projection is important as it anticipates a new impulsive phase following the corrective movements of blue wave 4. Blue wave 5 usually involves strong and decisive price actions, potentially leading to new market highs or lows.
Key details within this analysis highlight that blue wave 3 appears to be completed. This sets the stage for blue wave 4 of black wave 3 to either be in play or already completed. This phase often involves some retracement of the previous gains and is a natural part of the market's cyclical nature.
An important aspect of this analysis is the wave cancel invalid level, set at a specific price point. If the market price moves beyond this level, it would invalidate the current wave count and require a reassessment of the wave structure. This invalidation level serves as a critical checkpoint for confirming the accuracy of the Elliott Wave pattern and the expected market behavior.
In summary, the NIFTY 50 index is currently in a corrective phase within blue wave 4 on the daily chart, following the completion of blue wave 3. The market is either in the process of completing blue wave 4 or has already done so, setting the stage for the next impulsive phase, blue wave 5. Monitoring the invalidation level is crucial for validating the current wave structure and future market projections.
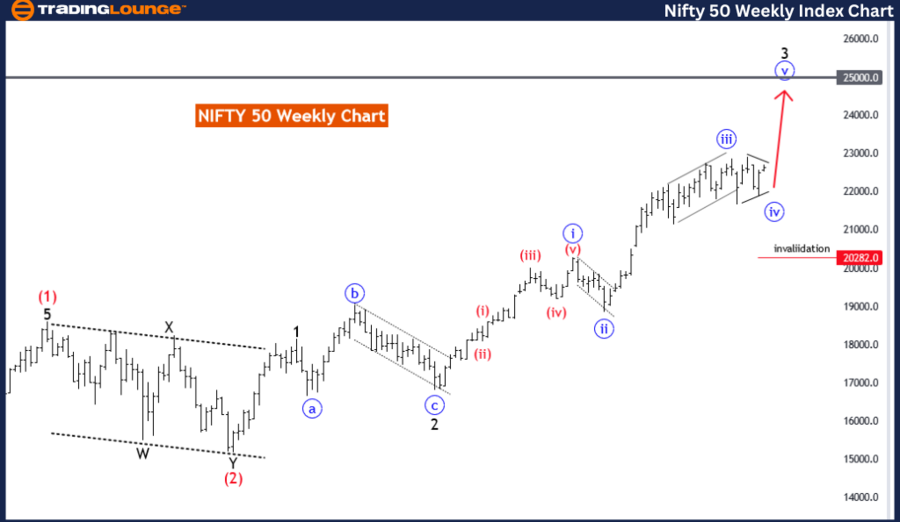
NIFTY 50 (INDIA) Elliott Wave Analysis Trading Lounge Weekly Chart,
NIFTY 50 (INDIA) Elliott Wave technical analysis
Function: Trend.
Mode: Corrective.
Structure: Blue Wave 4.
Position: Black Wave 3.
Direction next higher degrees: Blue Wave 5.
Details: Blue Wave 3 looking completed.
Now blue wave 4 of 3 is in play or completed.
Wave Cancel invalid level: 20282.0.
The NIFTY 50 (India) Elliott Wave analysis on the weekly chart provides an in-depth look at the market's current phase within the Elliott Wave sequence. The analysis identifies the primary function as a trend, indicating a broader, long-term market direction. The wave mode is classified as corrective, suggesting that the market is experiencing a retracement or consolidation within this larger trend.
The main structure highlighted in this analysis is blue wave 4, a crucial phase in the Elliott Wave cycle. This phase typically involves corrective patterns following the impulsive movements of the preceding waves. The current position within this structure is black wave 3, indicating that this phase is actively unfolding or nearing its end.
Looking forward, the direction for the next higher degrees points towards blue wave 5. This projection is significant as it anticipates a new impulsive phase following the corrective actions of blue wave 4. Blue wave 5 usually involves robust and decisive price movements, potentially leading to new market highs or lows.
Key details of the analysis reveal that blue wave 3 appears to be completed. This sets the stage for blue wave 4 of black wave 3 to either be in progress or already completed. This phase typically involves some retracement of the previous gains, reflecting the market's natural cyclical nature.
An essential aspect of this analysis is the wave cancel invalid level, set at a specific price point. If the market price moves beyond this level, it would invalidate the current wave count, necessitating a reassessment of the wave structure. This invalidation level acts as a critical checkpoint for confirming the accuracy of the Elliott Wave pattern and expected market behavior.
In summary, the NIFTY 50 index is currently in a corrective phase within blue wave 4 on the weekly chart, following the completion of blue wave 3. The market is either in the process of completing blue wave 4 or has already done so, preparing for the next impulsive phase, blue wave 5. Monitoring the invalidation level is crucial for validating the current wave structure and future market projections.
Technical analyst: Malik Awais.
NIFTY 50 (INDIA) Elliott Wave technical analysis [Video]
Author

Peter Mathers
TradingLounge
Peter Mathers started actively trading in 1982. He began his career at Hoei and Shoin, a Japanese futures trading company.


