NIFTY 50 (India) Index Elliott Wave technical analysis [Video]
![NIFTY 50 (India) Index Elliott Wave technical analysis [Video]](https://editorial.fxstreet.com/images/Markets/Equities/DowJones/dow-jones-industrial-average-on-iphone-4-stocks-app-16978003_XtraLarge.jpg)
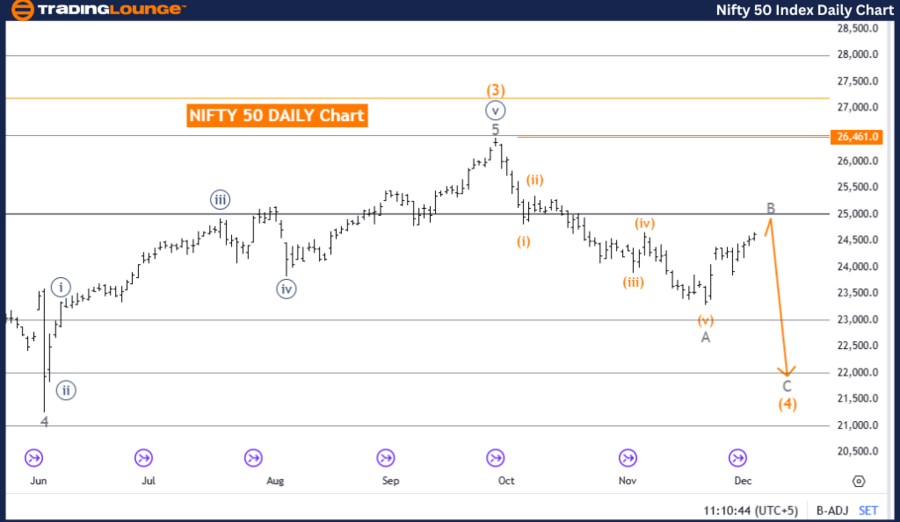
NIFTY 50 (India) Elliott Wave Analysis Trading Lounge Day Chart
NIFTY 50 (India) Elliott Wave technical analysis
-
Function: Counter Trend.
-
Mode: Corrective.
-
Structure: Gray Wave B.
-
Position: Orange Wave 4.
-
Direction next lower degrees: Gray Wave C.
-
Details: Gray Wave A of 4 appears to have completed; Gray Wave B of 4 is now active.
-
Wave cancel invalidation level: 26,461.0.
The NIFTY 50 daily chart reflects an Elliott Wave analysis indicating a counter-trend movement. The current wave structure is identified as gray wave B, part of a corrective phase within orange wave 4. According to the analysis, gray wave A of 4 has likely concluded, and the market is now advancing through gray wave B of 4.
This wave structure represents a temporary pause or reversal within the broader trend, characteristic of corrective phases in Elliott Wave Theory. The next anticipated progression is the development of gray wave C, which would complete the corrective sequence within orange wave 4.
An invalidation level for this wave count is set at 26,461.0. If the market moves below this level, the wave structure will need reassessment, potentially indicating a shift from the expected pattern.
This analysis offers traders a structured understanding of the ongoing corrective phase. It highlights key levels and directional trends, providing insights into potential price movements within this counter-trend scenario.
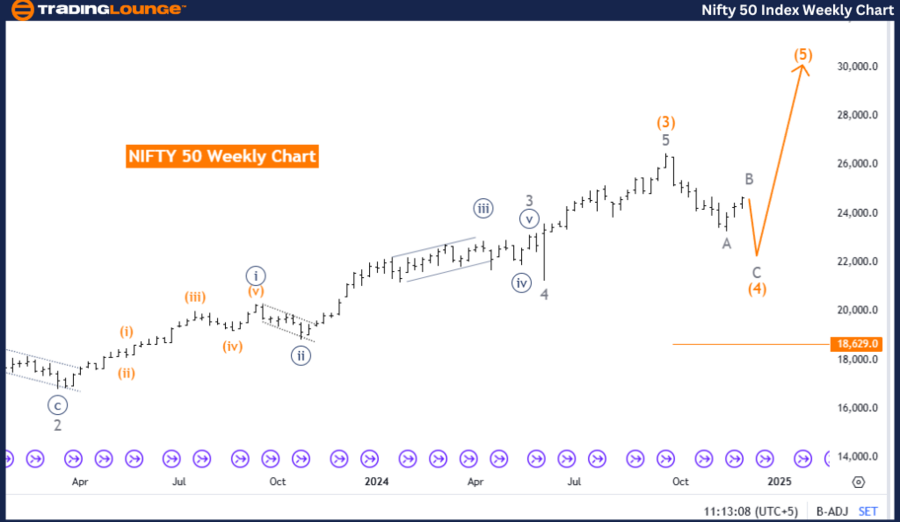
NIFTY 50 (India) Elliott Wave Analysis Trading Lounge Weekly Chart.
NIFTY 50 (India) Elliott Wave technical analysis
-
Function: Counter Trend.
-
Mode: Corrective.
-
Structure: Orange Wave 4.
-
Direction next higher degrees: Orange Wave 5.
-
Details: Orange Wave 3 appears to have completed; Orange Wave 4 is now active.
-
Wave cancel invalidation level: 18,629.0.
The NIFTY 50 weekly chart presents an Elliott Wave analysis suggesting a counter-trend movement. The current wave structure is identified as orange wave 4, which is part of a corrective phase. This follows the conclusion of orange wave 3, indicating a temporary consolidation or retracement before the larger trend resumes.
Based on the analysis, orange wave 4 is currently in progress, with the next anticipated movement being the development of orange wave 5 once the corrective phase concludes. This aligns with Elliott Wave Theory, which describes corrective phases as brief pauses in a broader trend.
An invalidation level for this wave count is set at 18,629.0. If the market moves beyond this level, the current wave structure would need reassessment, indicating a potential deviation from the expected pattern.
This analysis provides a clear perspective on the ongoing corrective phase, emphasizing critical levels and directional trends. It offers traders insights into potential market behavior, preparing them for the transition back to a bullish phase as orange wave 5 takes shape.
Technical analyst: Malik Awais.
NIFTY 50 (India) Elliott Wave technical analysis [Video]
Author

Peter Mathers
TradingLounge
Peter Mathers started actively trading in 1982. He began his career at Hoei and Shoin, a Japanese futures trading company.


