NIFTY 50 (INDIA) index Elliott Wave technical analysis [Video]
![NIFTY 50 (INDIA) index Elliott Wave technical analysis [Video]](https://editorial.fxstreet.com/images/Markets/Equities/Industries/Media/Netflix_XtraLarge.jpg)
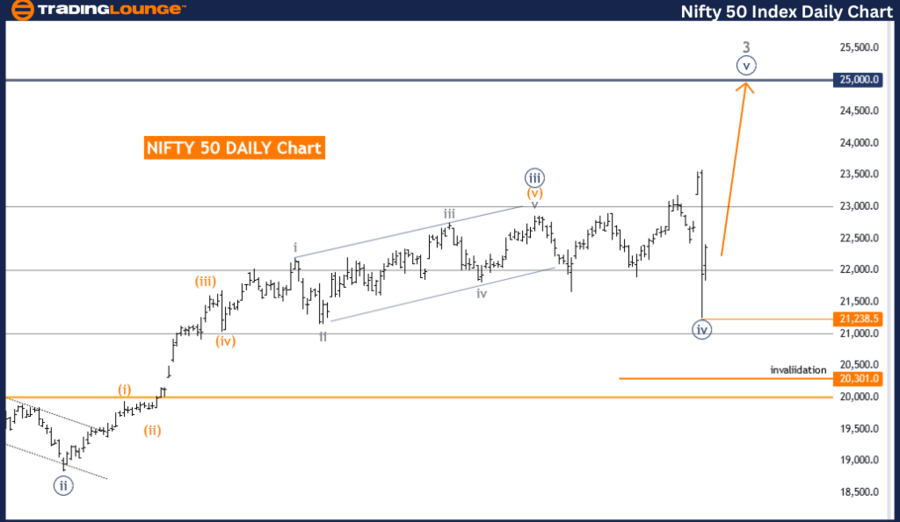
NIFTY 50(INDIA) Elliott Wave Analysis Trading Lounge Day Chart,
NIFTY 50 (INDIA) Elliott Wave technical analysis
Function: Trend.
Mode: Impulsive.
Structure: Navy Blue Wave 5.
Position: Gray Wave 3.
Direction next lower degrees: Gray Wave 4.
Details: Navy Blue Wave 4 looking completed.
Now Navy Blue Wave 5 of 3 is in play.
Wave Cancel invalid level: 20301.0.
The NIFTY 50 (India) Elliott Wave Analysis on the day chart focuses on understanding the current market trends using Elliott Wave Theory. This analysis identifies that the market function is trending, which means the overall movement is consistent with a primary trend direction. The mode being impulsive suggests strong movement in the direction of the trend, usually represented by a five-wave pattern.
In this case, the structure being examined is navy blue wave 5, which forms part of a larger gray wave 3. This indicates that the market is in an advanced stage of an upward trend, specifically in the final wave of the impulsive sequence. The current position within this structure is gray wave 3, implying that the market is experiencing the third wave within the larger wave 5.
The analysis details that Navy Blue Wave 4 appears to have been completed. This completion signifies the end of a corrective phase within the larger trend, allowing the market to resume its upward movement. Now, navy blue wave 5 of gray wave 3 is in play, which suggests continued upward momentum as this wave progresses.
The direction for the next lower degree is gray wave 4. This indicates the expected market movement once the current wave completes, likely involving a pullback or consolidation before potentially continuing the main trend.
The critical level to monitor is the wave cancel invalid level set at 20301.0. If the market price drops below this level, the current wave count would be invalidated, necessitating a reevaluation of the wave structure and possibly changing the market outlook.In summary, the NIFTY 50 Elliott Wave Analysis indicates an ongoing upward trend within an impulsive wave structure. With navy blue wave 4 completed and navy blue wave 5 of gray wave 3 currently in play, the market is expected to see further upward movement, as long as it stays above the critical invalidation level of 20301.0. This analysis provides important insights for traders regarding the current market dynamics and potential future trends.
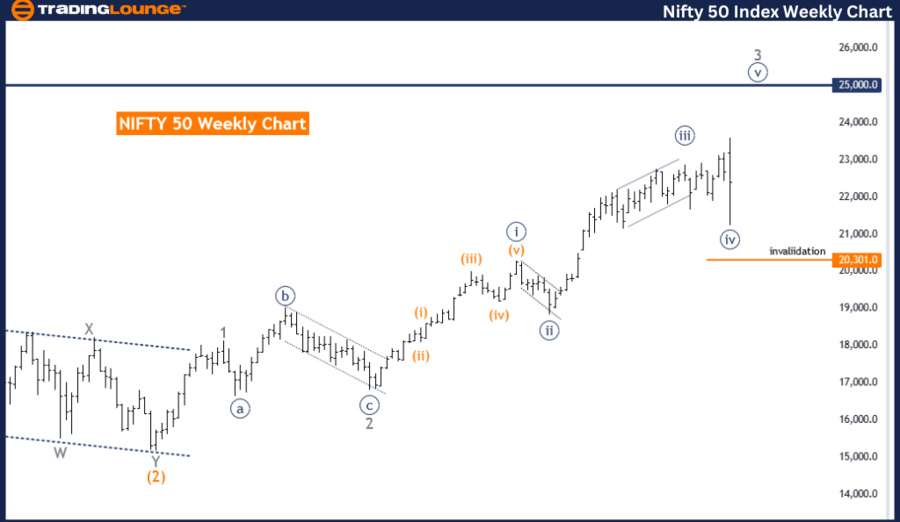
NIFTY 50(INDIA) Elliott Wave Analysis Trading Lounge Weekly Chart,
NIFTY 50 (INDIA) Elliott Wave technical analysis
Function: Trend.
Mode: Impulsive.
Structure: Navy Blue Wave 5.
Position: Gray wave 3.
Direction next lower degrees: Gray wave 4.
Details: Navy Blue Wave 4 looking completed.
Now Navy Blue Wave 5 of 3 is in play.
Wave Cancel invalid level: 20301.0.
The NIFTY 50 (India) Elliott Wave Analysis on the weekly chart focuses on understanding the market's long-term trend and forecasting its future movements using Elliott Wave Theory. This technical analysis aims to identify the current trend and predict the market's trajectory.
The analysis classifies the function as identifying and following the primary trend of the NIFTY 50 index. The mode is impulsive, which means the market is currently exhibiting strong, directional movements in line with the main trend. Impulsive waves are characterized by a sequence of five waves, indicating a robust market trend.
The structure being analyzed is the navy blue wave 5. This wave is part of a larger gray wave 3, indicating the market is in the third wave of a larger five-wave pattern, which typically suggests a continuing upward trend. The specific position of the market within this structure is gray wave 3, showing that the market is in the third wave of an impulsive sequence, which is generally the strongest and longest wave in the sequence.
The analysis details that the navy blue wave 4 is likely completed. This suggests that the market has finished a corrective phase and is now entering the fifth wave of the navy blue wave sequence, which is part of the larger gray wave 3. This new wave, navy blue wave 5 of 3, is now in play, indicating a continuation of the upward trend.
The wave cancel invalid level is set at 20301.0. This level acts as a critical point, where if the market moves below this level, it would invalidate the current wave count and suggest a different wave structure might be forming.
Overall, the NIFTY 50 is expected to continue its upward trend with navy blue wave 5 now active, following the completion of navy blue wave 4, within the larger structure of gray wave 3. The analysis helps traders and investors to anticipate future market movements and make informed decisions based on the Elliott Wave Theory.
Technical analyst: Malik Awais.
NIFTY 50 (INDIA) Elliott Wave technical analysis [Video]
Author

Peter Mathers
TradingLounge
Peter Mathers started actively trading in 1982. He began his career at Hoei and Shoin, a Japanese futures trading company.


