NIFTY 50 (India) Elliott Wave technical analysis [Video]
![NIFTY 50 (India) Elliott Wave technical analysis [Video]](https://editorial.fxsstatic.com/images/i/General-Stocks_1_XtraLarge.png)
NIFTY 50 (India) wave technical analysis
-
Function: Counter Trend.
-
Mode: Impulsive.
-
Structure: Navy Blue Wave 5.
-
Position: Gray Wave C.
-
Direction next higher degrees: Navy Blue Wave 1.
Analysis details
The NIFTY 50 (India) Elliott Wave Analysis for the day chart highlights a counter-trend scenario, indicating an impulsive mode within the market structure.
Currently, the market is in Navy Blue Wave 5, which is part of a larger corrective pattern within Gray Wave C. This suggests that the market is experiencing a strong upward phase, characteristic of an impulsive wave structure.
The next higher-degree movement anticipated is Navy Blue Wave 1, which is likely to begin following the completion of Navy Blue Wave 5.
Key observations
-
Navy Blue Wave 4 appears to be completed, and the market is progressing through Navy Blue Wave 5 of Gray Wave C.
-
This wave is expected to exhibit strong upward momentum, aligning with the impulsive nature of the trend.
-
Traders should monitor the development of Navy Blue Wave 5, as its completion will signal the potential start of Navy Blue Wave 1, which is expected to drive the market in the direction of the larger trend.
Conclusion
The NIFTY 50 is currently in an impulsive phase within its Elliott Wave structure, with Navy Blue Wave 5 in play following the completion of Navy Blue Wave 4. This impulsive movement is part of Gray Wave C, with the next major move expected to be Navy Blue Wave 1.
Traders should closely monitor the completion of Navy Blue Wave 5, as it will provide insights into the timing and direction of the next higher-degree wave.
This analysis emphasizes the importance of understanding wave structures to anticipate potential market movements and optimize trading strategies accordingly.
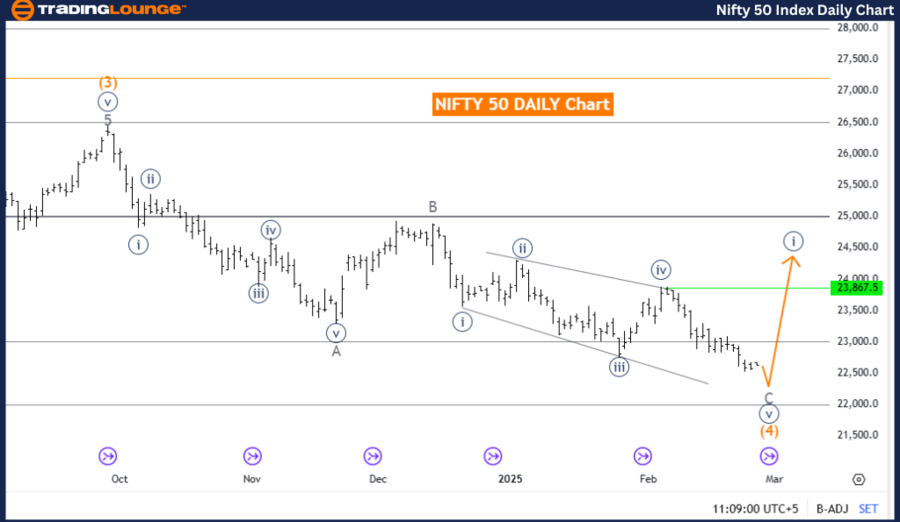
Daily chart
NIFTY 50 (India) wave technical analysis
-
Function: Counter Trend
-
Mode: Impulsive
-
Structure: Gray Wave C
-
Position: Orange Wave 4
-
Direction next higher degrees: Gray Wave 1 of 5
Analysis details
The NIFTY 50 (India) Elliott Wave Analysis for the weekly chart presents a counter-trend scenario, indicating an impulsive mode within the market structure.
Currently, the market is in Gray Wave C, which is part of a larger corrective pattern within Orange Wave 4. This suggests that the market is in a strong upward phase, characteristic of an impulsive wave structure.
The next higher-degree movement anticipated is Gray Wave 1 of 5, which is expected to follow the completion of Gray Wave C.
Key observations
- Gray Wave C of Orange Wave 4 is currently in play and appears to be nearing its completion.
- This wave is expected to exhibit strong upward momentum, consistent with the impulsive nature of the trend.
- Traders should closely monitor Gray Wave C, as its completion will signal the potential start of Gray Wave 1 of 5, which is expected to drive the market in the direction of the larger trend.
Conclusion
The NIFTY 50 is currently in an impulsive phase within its Elliott Wave structure, with Gray Wave C in play as part of Orange Wave 4.
This impulsive movement is nearing its end, and the next major move is anticipated to be Gray Wave 1 of 5.
Traders should monitor the completion of Gray Wave C, as it will provide insights into the timing and direction of the next higher-degree wave.
This analysis highlights the importance of understanding wave structures to anticipate potential market movements and optimize trading strategies accordingly.
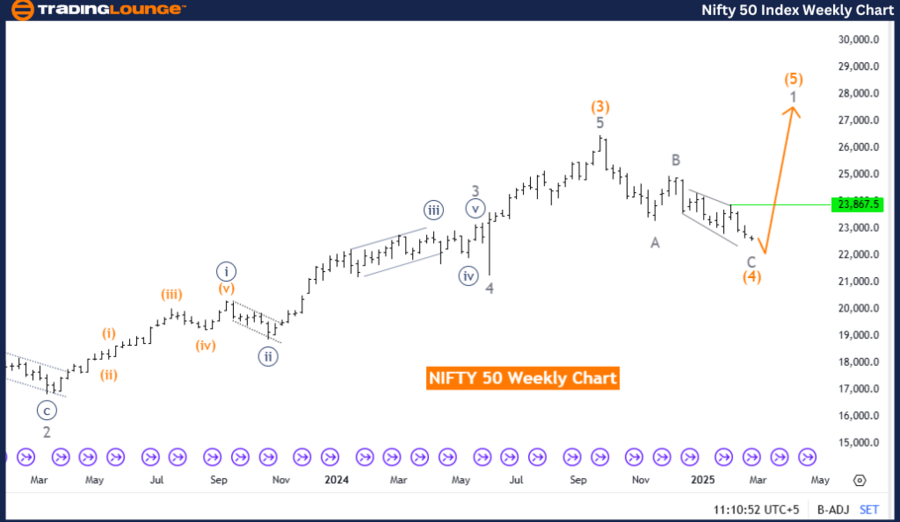
Weekly Chart
NIFTY 50 (India) Elliott Wave technical analysis [Video]
Author

Peter Mathers
TradingLounge
Peter Mathers started actively trading in 1982. He began his career at Hoei and Shoin, a Japanese futures trading company.


