NIFTY 50 (INDIA) Elliott Wave technical analysis [Video]
![NIFTY 50 (INDIA) Elliott Wave technical analysis [Video]](https://editorial.fxstreet.com/images/Markets/Currencies/Majors/USDCAD/background-of-canadian-fifty-and-hundred-dollar-bills-2910964_XtraLarge.jpg)
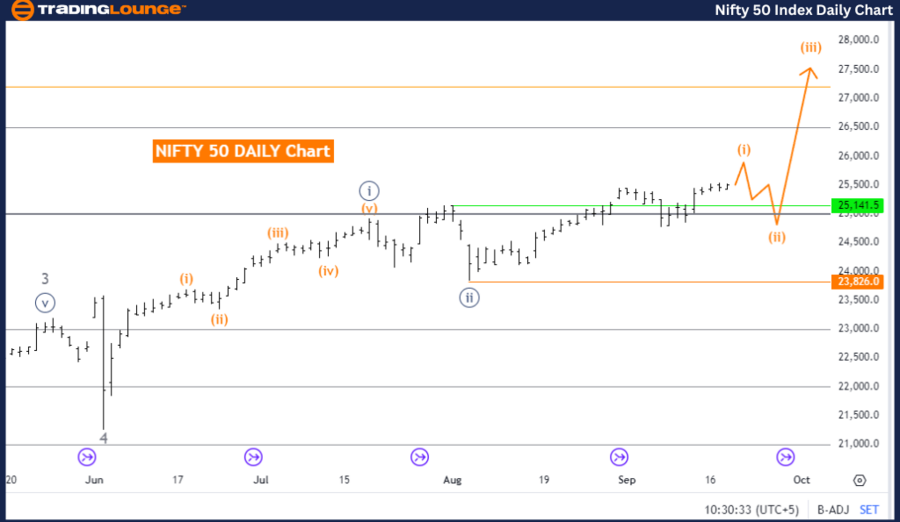
NIFTY 50 (INDIA) Elliott Wave Analysis - Daily Chart.
NIFTY 50 (INDIA) Elliott Wave technical analysis
-
Function: Trend.
-
Mode: Impulsive.
-
Structure: Orange Wave 1.
-
Position: Navy Blue Wave 3.
-
Direction next lower degrees: Orange Wave 2.
-
Details: Navy Blue Wave 2 appears complete, with Orange Wave 1 of Navy Blue Wave 3 now in play.
Wave cancel invalidation level: 23,826.0.
The NIFTY 50 (India) Elliott Wave analysis on the daily chart suggests the market is currently in a trending phase. The overall movement is categorized as impulsive, and the structure under observation is Orange Wave 1. This signifies the early development of a larger wave formation, indicating that the market is embarking on a new upward cycle within the Elliott Wave framework.
At present, the market is positioned within Navy Blue Wave 3, which follows the completion of Navy Blue Wave 2. Historically, Wave 3 within Elliott Wave theory tends to exhibit strong upward momentum, aligning with the impulsive nature of the broader trend. The shift from Wave 2 to Wave 3 often signals the beginning of a more powerful and sustained movement in the direction of the overall trend.
Key Observations:
-
Navy Blue Wave 2 is now presumed complete.
-
Orange Wave 1 of Navy Blue Wave 3 is currently unfolding, suggesting the market is in the early stages of a potentially significant upward move.
-
The impulsive structure indicates that further upward progression is likely, with Orange Wave 2 expected to follow once Orange Wave 1 concludes.
Wave Invalidation Level:
The invalid level for the current wave scenario is set at 23,826.0. If the price drops below this threshold, the existing wave pattern would be considered invalid, requiring a reevaluation of the market structure. As long as the price remains above this level, the ongoing impulsive trend is expected to persist, with Orange Wave 1 continuing its formation within Navy Blue Wave 3.
Summary:
On the daily chart, the NIFTY 50 is in an impulsive phase, with Orange Wave 1 of Navy Blue Wave 3 actively progressing. The bullish trend is anticipated to continue, provided the price does not break below the invalidation level of 23,826.0.
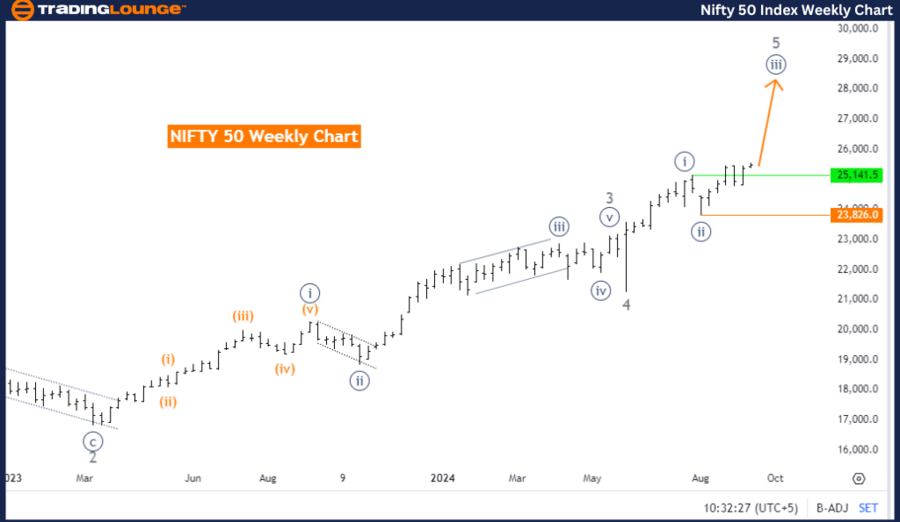
NIFTY 50 (INDIA) Elliott Wave Analysis - Weekly Chart.
NIFTY 50 (INDIA) Elliott Wave technical analysis
-
Function: Trend.
-
Mode: Impulsive.
-
Structure: Navy Blue Wave 3.
-
Position: Gray Wave 5.
-
Direction next higher degrees: Navy Blue Wave 3 (continuing).
-
Details: Navy Blue Wave 2 of 5 appears complete, with Navy Blue Wave 3 now unfolding.
Wave cancel invalidation level: 23,826.0.
The NIFTY 50 (India) Elliott Wave analysis on the weekly chart indicates the market is in a strong upward trend, classified as impulsive. The structure being analyzed is Navy Blue Wave 3, which is part of the larger Gray Wave 5. This setup suggests the market is in the midst of a significant upward cycle, with further upward potential as Wave 3 progresses.
Currently, the market is positioned within Navy Blue Wave 3, following the completion of Navy Blue Wave 2 of 5. This implies that the correction phase linked to Wave 2 has concluded, and the market has entered the impulsive phase of Wave 3. Historically, Wave 3 often represents a robust and extended movement in the trend's direction, aligning with the current market conditions.
Key Insights:
-
Navy Blue Wave 3 is expected to push the market further upward, continuing the momentum from the impulsive phase.
-
The market’s trend is not only sustained but appears to be strengthening as it progresses through Navy Blue Wave 3.
Wave Invalidation Level:
The invalidation level for this wave count is set at 23,826.0. If the price were to drop below this level, the existing Elliott Wave scenario would be invalid, and the market structure would need to be reassessed. However, as long as the price stays above this threshold, the current upward trend, driven by Navy Blue Wave 3, is expected to persist.
Summary:
In the weekly chart, NIFTY 50 is experiencing an impulsive upward trend, with Navy Blue Wave 3 actively forming within the larger structure of Gray Wave 5. The completion of Navy Blue Wave 2 marks the beginning of a stronger upward movement in Wave 3, provided the price holds above the invalidation level of 23,826.0.
Technical analyst: Malik Awais.
NIFTY 50 (INDIA) Elliott Wave technical analysis [Video]
Author

Peter Mathers
TradingLounge
Peter Mathers started actively trading in 1982. He began his career at Hoei and Shoin, a Japanese futures trading company.


