NIFTY 50 (India) Elliott Wave technical analysis [Video]
![NIFTY 50 (India) Elliott Wave technical analysis [Video]](https://editorial.fxstreet.com/images/TechnicalAnalysis/ChartPatterns/Chartism/mobile-phone-with-stock-chart-62799468_XtraLarge.jpg)
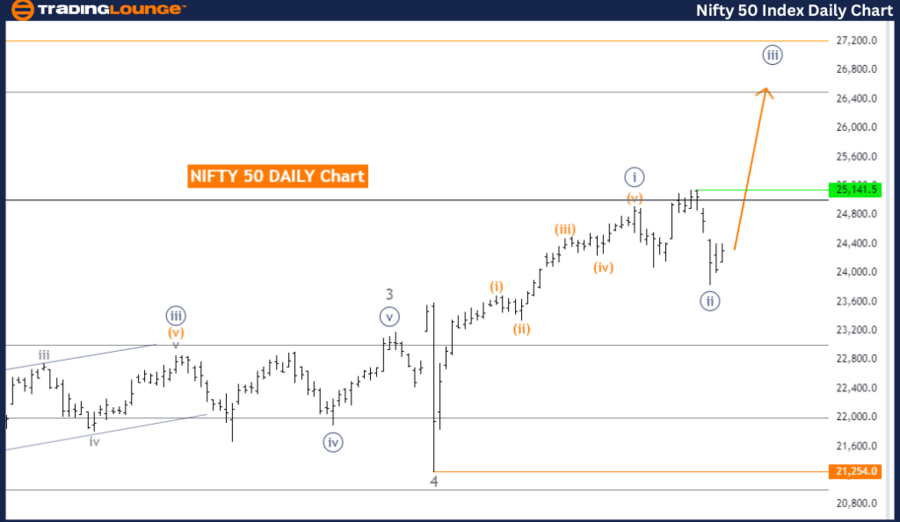
NIFTY 50 (India) Elliott Wave Analysis Trading Lounge Day Chart
NIFTY 50 (India) Elliott Wave technical analysis
Function: Trend.
Mode: Impulsive.
Structure: Navy Blue Wave 3.
Position: Gray Wave 5.
Direction next higher degrees: Navy Blue Wave 3 (started).
Details: Navy Blue Wave 2 of 5 looking completed. Now Navy Blue Wave 3 is in play.
Wave cancel invalid level: 21,254.0.
The NIFTY 50 (India) Elliott Wave Analysis on the daily chart reveals that the market is in a trend mode characterized by an impulsive wave pattern. The specific wave structure being analyzed is Navy Blue Wave 3, which signifies a continuation of the current trend.
At present, the market is positioned in Gray Wave 5, indicating that it is in the final phase of this particular wave sequence. The direction for the next higher degrees continues to be Navy Blue Wave 3, suggesting that the market's impulsive trend is expected to persist.
The details of the analysis highlight that Navy Blue Wave 2 of 5 appears to be completed. This completion marks a critical transition point, where the market has moved past the corrective phase of Wave 2 and has now entered into the more aggressive and trend-confirming phase of Navy Blue Wave 3. This phase is typically associated with strong market movements and increased momentum.
The wave cancel invalid level is set at 21,254.0. This level is essential as it acts as a validation point for the current wave structure. If the NIFTY 50 index were to fall below this level, it would invalidate the current wave count, suggesting that the anticipated progression from Navy Blue Wave 2 to Navy Blue Wave 3 may not be occurring as expected. Such an event would necessitate a reevaluation of the wave count and overall market outlook.
In summary, the NIFTY 50 (India) Elliott Wave Analysis on the daily chart indicates that the market is in an impulsive trend phase, currently positioned in Gray Wave 5 within the broader context of Navy Blue Wave 3. With Navy Blue Wave 2 of 5 completed, the market is now progressing through Navy Blue Wave 3, characterized by strong upward momentum. The wave cancel invalid level at 21,254.0 is critical for maintaining the validity of this wave structure, with any breach requiring a reassessment of the market's future direction.
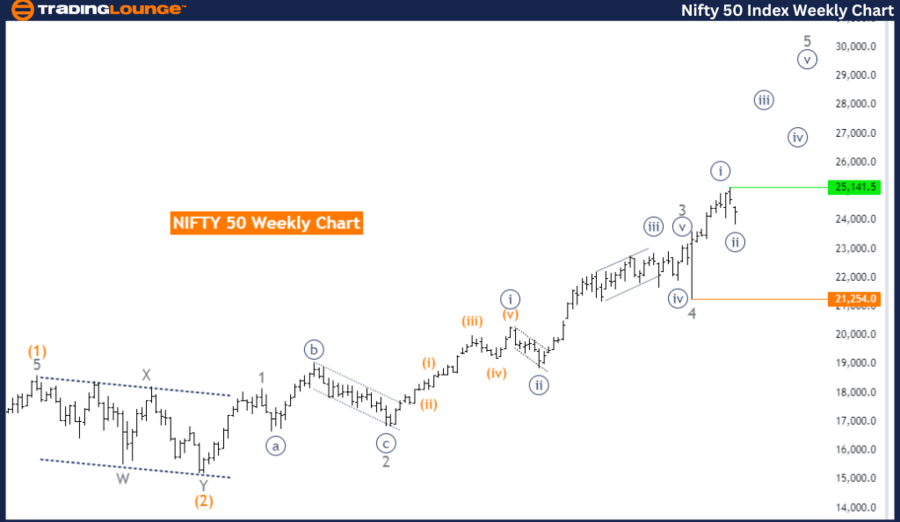
NIFTY 50 (India) Elliott Wave Analysis Trading Lounge Weekly Chart
NIFTY 50 (India) Elliott Wave technical analysis
Function: Trend.
Mode: Impulsive.
Structure: Navy Blue Wave 3.
Position: Gray Wave 5.
Direction next higher degrees: Navy Blue Wave 3 (started).
Details: Navy Blue Wave 2 of 5 looking completed. Now Navy Blue Wave 3 is in play.
Wave cancel invalid level: 21,254.0.
The NIFTY 50 (India) Elliott Wave Analysis on the weekly chart indicates that the market is in a trend mode, characterized by an impulsive wave pattern. The specific wave structure being analyzed is Navy Blue Wave 3, which suggests the continuation of the current upward trend.
The market is currently positioned in Gray Wave 5, indicating it is in the final phase of this particular wave sequence. The direction for the next higher degrees is Navy Blue Wave 3, signifying that the impulsive trend is expected to continue.
According to the analysis, Navy Blue Wave 2 of 5 appears to be completed. This completion marks an important transition point, indicating that the market has moved past the corrective phase of Wave 2 and is now entering the more aggressive and trend-confirming phase of Navy Blue Wave 3. This phase typically involves strong market movements and increased momentum.
The wave cancel invalid level is set at 21,254.0. This level acts as a critical validation point for the current wave structure. If the NIFTY 50 index falls below this level, it would invalidate the current wave count, suggesting that the anticipated progression from Navy Blue Wave 2 to Navy Blue Wave 3 may not be occurring as expected. In such a scenario, a reevaluation of the wave count and overall market outlook would be necessary.
In summary, the NIFTY 50 (India) Elliott Wave Analysis on the weekly chart shows the market is in an impulsive trend phase, currently positioned in Gray Wave 5 within the broader context of Navy Blue Wave 3. With Navy Blue Wave 2 of 5 completed, the market is now progressing through Navy Blue Wave 3, characterized by strong upward momentum. The wave cancel invalid level at 21,254.0 is crucial for maintaining the validity of this wave structure, with any breach requiring a reassessment of the market's future direction.
Technical analyst: Malik Awais.
NIFTY 50 (India) Elliott Wave technical analysis [Video]
Author

Peter Mathers
TradingLounge
Peter Mathers started actively trading in 1982. He began his career at Hoei and Shoin, a Japanese futures trading company.


