NIFTY 50 INDEX (India) Elliott Wave technical analysis [Video]
![NIFTY 50 INDEX (India) Elliott Wave technical analysis [Video]](https://editorial.fxstreet.com/images/i/chameleon-chart-1_XtraLarge.png)
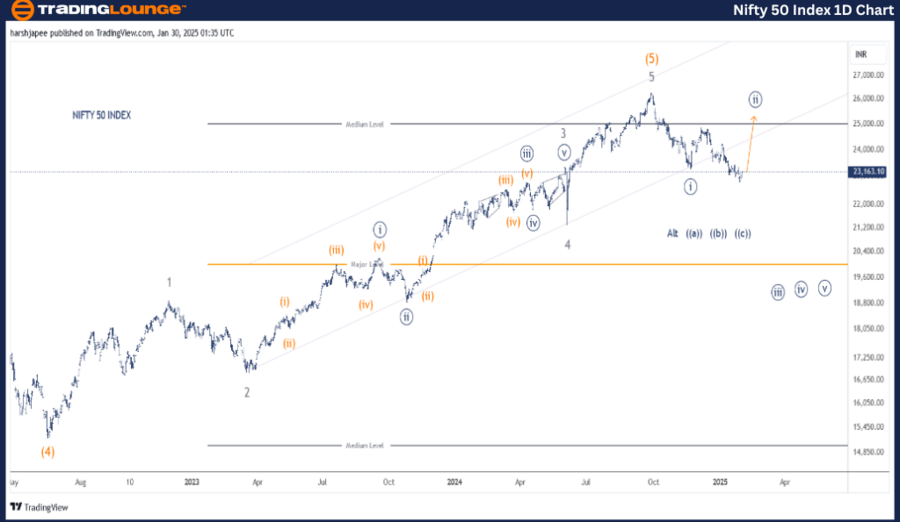
NIFTY 50 INDEX – NIFTY (1D chart) Elliott Wave technical analysis
Function: Counter Trend (Minor degree, Grey.).
Mode: Corrective.
Structure: Impulse within larger degree.
Position: Minute Wave ((ii)).
Details: Minute Wave ((ii)) could be progressing towards 25000 range before the drop resumes. The correction is unfolding as an expanded flat. If correct, a rally should be underway soon. Alternatively, the entire structure from 26300 high is unfolding as a correction at Minute degree.
Invalidation point: 26400.
NIFTY 50 INDEX Daily Chart Technical Analysis and potential Elliott Wave Counts:
NIFTY 50 INDEX daily chart suggests a major top in place around 26300 mark in September 2024. The index has reversed lower carving Minute Wave ((i)) around the 23267 mark. It is unfolding a potential expanded flat corrective wave towards 25000-100 zone since then. An alternative count is presented below.
The index terminated Intermediate Wave (4) around 15200 mark in June 2022. Since then, bulls have managed to push through the 26300 zone sub dividing into five waves at Minor degree marked as Wave 1 through 5.
It the above structure holds well, NIFTY 50 INDEX has turned lower to unfold a corrective pattern at a larger degree against 26300 mark.
NIFTY 50 INDEX – NIFTY (4H chart) Elliott Wave technical analysis
Function: Counter Trend (Minor degree, Grey.).
Mode: Corrective.
Structure: Impulse within larger degree.
Position: Minute Wave ((ii)).
Details: Minute Wave ((ii)) could be progressing towards 25000 range before the drop resumes. The correction is unfolding as an expanded flat (a)-(b)-(c). If correct, a rally should be underway soon. Alternatively, the entire structure from 26300 high is unfolding as a correction at Minute degree. Either way, high probability remains for a turn higher soon.
Invalidation point: 26400.
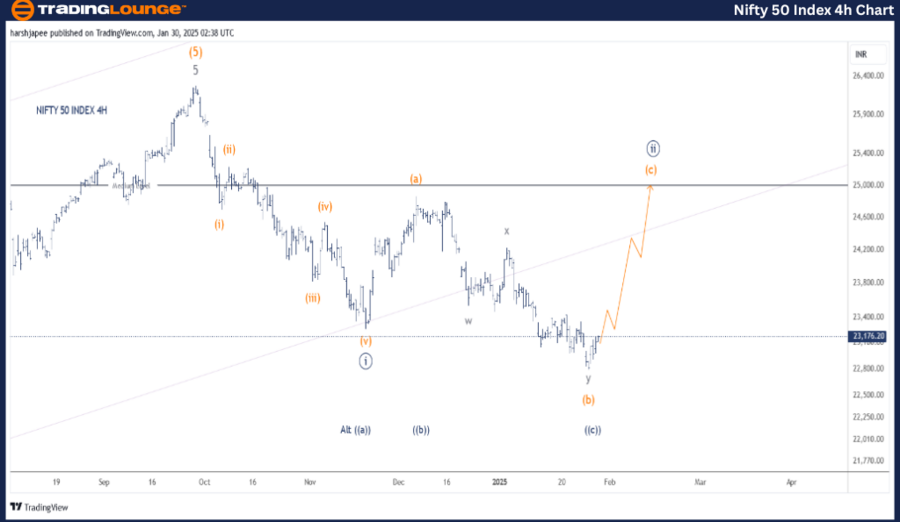
NIFTY 50 INDEX 4H Chart Technical Analysis and potential Elliott Wave Counts:
NIFTY 50 INDEX 4H chart is highlighting the potential counts since the indice rallied through the 26280-300 high on September 27, 2024. The initial drop to 23267 low was an impulse at Minuette Degree labelled as Waves (i) through (v) Orange to terminate Wave ((i)) at Minute degree.
The structure thereafter could be seen unfolding as a potential expanded flat (a)-(b)-(c), which could prepare to push towards 25000-100 region going forward. Please note Wave (b) might be unfolding as a combination w-x-y Grey (Sub Minuette).
If the above is correct, bulls should be underway towards 25000-100 range and a break above 23430 will confirm. Alternatively, the entire structure from 26300 through today could be a corrective ((a))-((b))-((c)) wave as bulls prepare to come back in control.
Conclusion:
NIFTY 50 INDEX is progressing higher towards 25000-100 zone within Minuette Wave (c) Orange to terminate Minute Wave ((ii)).
Elliott Wave analyst: Harsh Japee.
NIFTY 50 INDEX – NIFTY Elliott Wave technical analysis [Video]
Author

Peter Mathers
TradingLounge
Peter Mathers started actively trading in 1982. He began his career at Hoei and Shoin, a Japanese futures trading company.


