NIFTY 50 Index Elliott Wave technical analysis [Video]
![NIFTY 50 Index Elliott Wave technical analysis [Video]](https://editorial.fxsstatic.com/images/i/General-Stocks_2_XtraLarge.png)
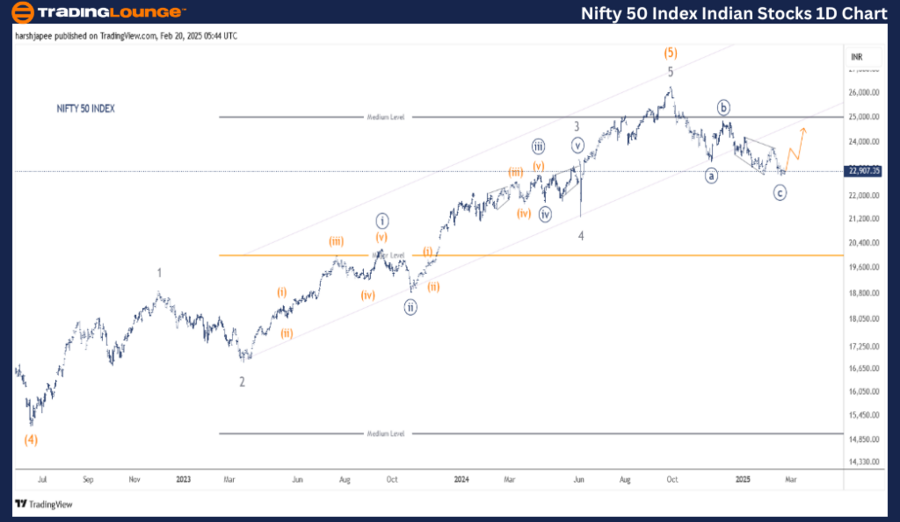
NIFTY 50 INDEX – NIFTY (1D Chart).
Elliott Wave technical analysis
-
Function: Counter Trend (Minor Degree, Grey).
-
Mode: Corrective.
-
Structure: Zigzag Complete at Minute Degree.
-
Position: Minute Wave ((c)).
-
Details:
-
The alternate count is now the preferred one, with the Zigzag structure appearing complete at Minute degree ((a)) - ((b)) - ((c)).
-
The 22,700 - 22,800 zone could act as a potential termination area for Minute Wave ((c)), likely leading to a counter-trend rally soon.
-
A break above 23,800 will further confirm the move.
-
-
Invalidation point: 26,400.
NIFTY 50 Index - Daily chart technical analysis and potential Elliott Wave counts
The NIFTY 50 daily chart analysis suggests that a major top was formed around 26,300 in September 2024.
A high-probability wave count indicates:
-
The index carved Minute Wave ((a)) near 23,267, followed by Wave ((b)) and ((c)), reaching 24,900 and the 22,700 - 22,800 zone.
-
Previously, the index formed Intermediate Wave (4) Orange near the 15,200 lows, followed by an impulse wave at Minor Degree (1-5) that pushed prices to 26,300, marking Wave (5)’s termination.
-
Bulls may attempt a rally towards the 24,900 - 25,100 range in the near future. Alternatively, if the correction is complete at 22,700, the index could turn higher towards 26,300.
NIFTY Elliott Wave technical analysis
-
Function: Counter Trend (Minor Degree, Grey).
-
Mode: Corrective.
-
Structure: Zigzag Complete at Minute Degree.
-
Position: Minute Wave ((c)).
-
Details:
-
The alternate count remains preferred, with Zigzag looking complete at Minute Degree ((a)) - ((b)) - ((c)).
-
Minute Wave ((c)) might have unfolded as an ending diagonal.
-
The 22,700 - 22,800 zone remains a potential termination area for Minute Wave ((c)), likely triggering a counter-trend rally soon.
-
A break above 23,800 will further confirm this move.
-
-
Invalidation point: 26,400.
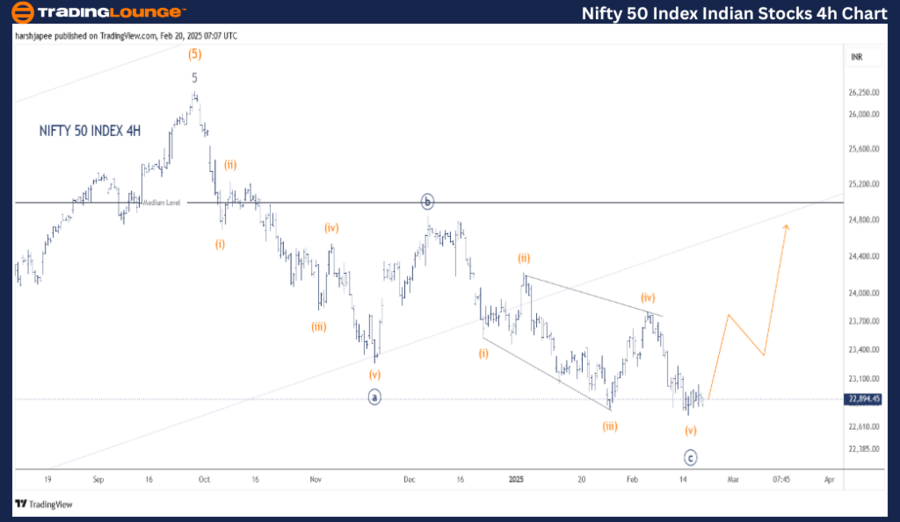
NIFTY 50 Index - Four-hour chart technical analysis and potential Elliott Wave counts
The NIFTY 50 4H chart highlights potential wave counts since the index reached the 26,280 - 26,300 high on September 27, 2024.
Wave structure adjustments suggest:
-
The ((a)) - ((b)) - ((c)) Zigzag correction may have completed from the 26,280 highs.
-
The initial drop to 23,257 has been labeled as Minute Wave ((a)), followed by Wave ((b)) reaching the 24,900 zone.
-
Minute Wave ((c)) possibly unfolded as a diagonal structure, completing near the 22,700 - 22,800 zone.
-
If this holds, the index could now:
-
Enter a counter-trend rally towards the 24,400 - 24,500 zone within a larger-degree correction.
-
Resume an upward move towards new highs above 26,300.
-
A break above 23,900 would confirm that bulls are back in control.
-
Conclusion
The NIFTY 50 INDEX appears to be progressing higher towards the 25,000 - 25,100 zone within a larger-degree corrective structure.
NIFTY 50 Index Elliott Wave technical analysis [Video]
Author

Peter Mathers
TradingLounge
Peter Mathers started actively trading in 1982. He began his career at Hoei and Shoin, a Japanese futures trading company.


