NIFTY 50 INDEX Elliott Wave technical analysis [Video]
![NIFTY 50 INDEX Elliott Wave technical analysis [Video]](https://editorial.fxstreet.com/images/Markets/Equities/Industries/Insurance/pic-signing-contract-637435374858445846_XtraLarge.jpg)
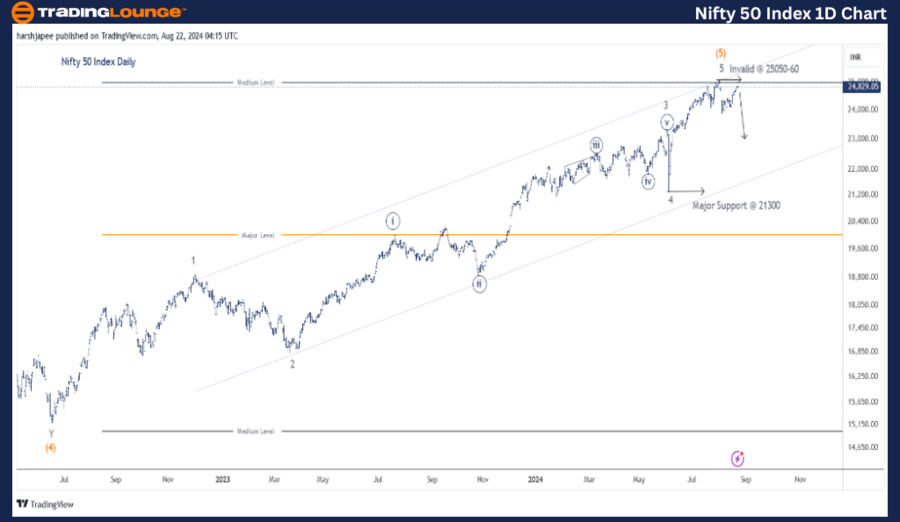
NIFTY 50 INDEX – NIFTY (1D chart) Elliott Wave/technical analysis
Function: Corrective Lower (Intermediate degree, orange.).
Mode: Corrective.
Structure: Potential Impulse within larger degree Corrective Wave.
Position: Potential Minute Wave ((ii)). Not marked as still early.
Details: As discussed earlier, potential Minor Wave 5 Grey of Intermediate Wave (5) Orange might be complete around 25100 mark. Furthermore Minute Waves ((i)) and ((ii)) (not labelled on Daily Chart) could be complete around 23900 and 24800-50 zones respectively. If correct, prepare for a sharp decline from here against 25100
Invalidation point: 25100-50
Nifty 50 Index Daily Chart Technical Analysis and potential Elliott Wave Counts:
Nifty 50 daily chart is suggesting a potential top carved around 25100 on August 01, 2024. If correct, the termination is at multiple degrees Minor, Intermediate. Primary and potentially Cycle Wave III. Alternatively, Minor Wave 5 is extending and 25100 could be Minute Wave ((i)).
Nifty 50 has potentially terminated Cycle Wave III since 2500 lows carved in 2009. If correct, a much deeper correction could be underway soon against 25100 high. A drag below 23900 would be initial sign of bears coming back in control.
If the above structure holds, an intermediate target could be potentially towards 21300, which is Minute Wave 4 of one lesser degree. Alternatively, a push above 25100 would confirm that Minor Wave 5 is extending.
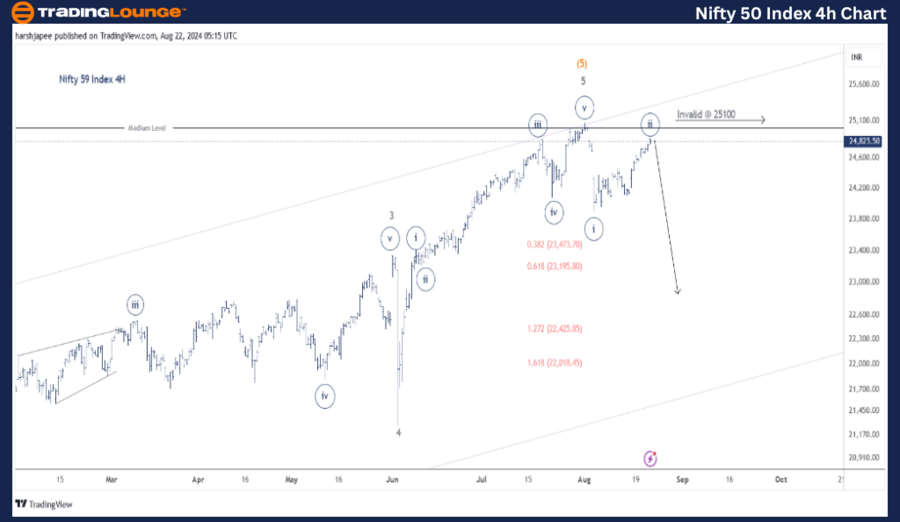
NIFTY 50 INDEX – NIFTY (4H chart) Elliott Wave/technical analysis
Function: Corrective Lower (Minor degree, Grey.).
Mode: Corrective.
Structure: Potential Impulse within larger degree Corrective Wave.
Position: Potential Minute Wave ((iii)).
Details: Minute Wave ((ii)) unfolding within Minor Wave 1 against 25100.
Invalidation point: 25100-50.
Nifty 50 Index 4H Chart Technical Analysis and potential Elliott Wave Counts:
Nifty 50 4H potential wave counts indicate Minute Waves ((i)) and ((ii)) complete around 23900-30 and 24800-50 zones respectively. If correct, the index would be soon underway lower as Wave ((iii)) begins to unfold. A push through 25100 voids the above bearish scenario.
Conclusion
Nifty 50 Index is about to resume Minute Wave ((iii)) of Minor Wave 1 lower against 25100 highs. A potential right shoulder is being carved around 24800-30 zone at the time of writing.
Elliott Wave analyst: Harsh Japee.
NIFTY 50 INDEX – NIFTY (4H chart) Elliott Wave/technical analysis [Video]
Author

Peter Mathers
TradingLounge
Peter Mathers started actively trading in 1982. He began his career at Hoei and Shoin, a Japanese futures trading company.


