NextEra Energy Inc.(NEE) Elliott Wave technical analysis [Video]
![NextEra Energy Inc.(NEE) Elliott Wave technical analysis [Video]](https://editorial.fxstreet.com/images/TechnicalAnalysis/ChartPatterns/PointFigure/stock-market-data-18635784_XtraLarge.jpg)
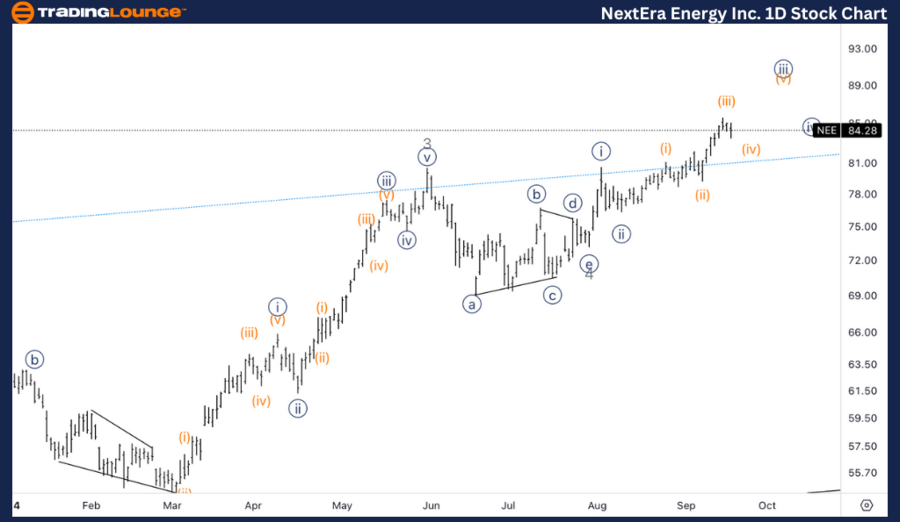
NEE Elliott Wave Analysis Trading Lounge Daily Chart,
NEE Elliott Wave technical analysis
Function: Trend.
Mode: Impulsive.
Structure: Motive.
Position: Wave 5 of (1).
Direction: Upside in 5.
Details: Looking for upside into wave 5 in what appears to be a post triangle thrust. Looking for 100$ to be the next TradingLevels to be reached.
NEE Elliott Wave technical analysis – Daily chart
The daily chart shows that NextEra Energy is in the midst of an impulsive trend, currently progressing through Wave 5 of (1). The stock is expected to move higher within this fifth wave, signaling the completion of an impulsive structure in Wave (1).
A post-triangle thrust is evident, suggesting that Wave 5 is unfolding after a triangle in Wave 4, which often leads to a sharp move higher. The next major target on the upside is the key psychological level at $100, which also aligns with TradingLevel 100 (TL100). Traders should monitor price action as it approaches this level for potential profit-taking or signs of resistance.
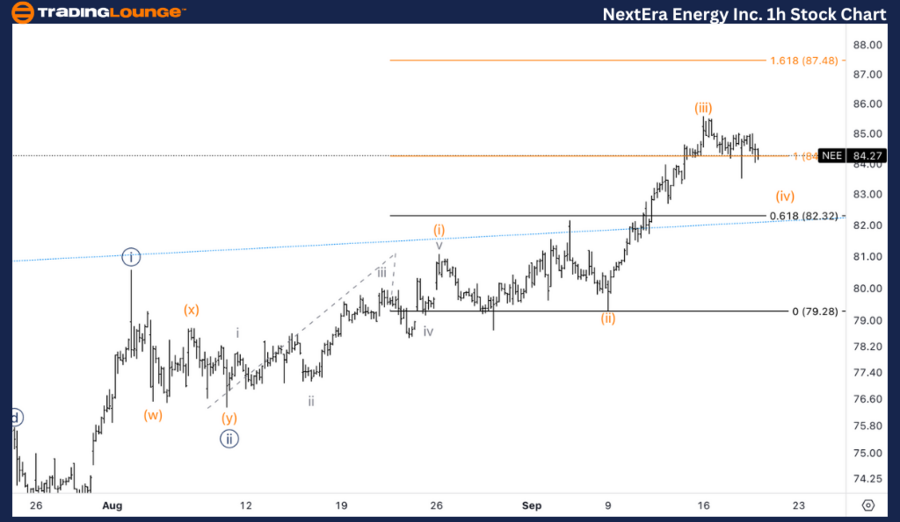
NEE Elliott Wave Analysis Trading Lounge 1H Chart.
NEE Elliott Wave technical analysis
Function: Trend .
Mode: Impulsive.
Structure: Motive.
Position: Wave (iv) of {iii}.
Direction: Upside in wave {iii}.
Details: Looking for a potential wave (iv) to be in the making or near completion as it is finding support on top of equality of (iii) vs. (i). Looking for overall resumption after we trade above 85$.
NEE Elliott Wave technical analysis – One-hour chart
On the 1-hour chart, NextEra Energy is currently in Wave (iv) of {iii}, which appears to be either in its final stages or nearing completion. The stock is finding support around the equality level of Wave (iii) vs. (i), a typical retracement level for Wave (iv). Once this correction concludes, we expect an upward continuation into Wave (v) of {iii}, signaling further bullish momentum.
A key confirmation level to watch is $85. Once the stock trades above this level, it would suggest that the corrective phase has ended and the next impulsive move higher is underway, targeting further gains in Wave {iii}.
In this Elliott Wave analysis of NextEra Energy Inc. (NEE), we will explore the stock’s current price action to offer insights into potential trading opportunities. We will break down both the daily and 1-hour charts to give a clear view of the stock's position within the Elliott Wave structure.
NextEra Energy Inc.(NEE) Elliott Wave technical analysis [Video]
Author

Peter Mathers
TradingLounge
Peter Mathers started actively trading in 1982. He began his career at Hoei and Shoin, a Japanese futures trading company.


