NextEra Energy Inc.(NEE) Elliott Wave technical analysis [Video]
![NextEra Energy Inc.(NEE) Elliott Wave technical analysis [Video]](https://editorial.fxstreet.com/images/Markets/Equities/Industries/Food/water-bottles_XtraLarge.jpg)
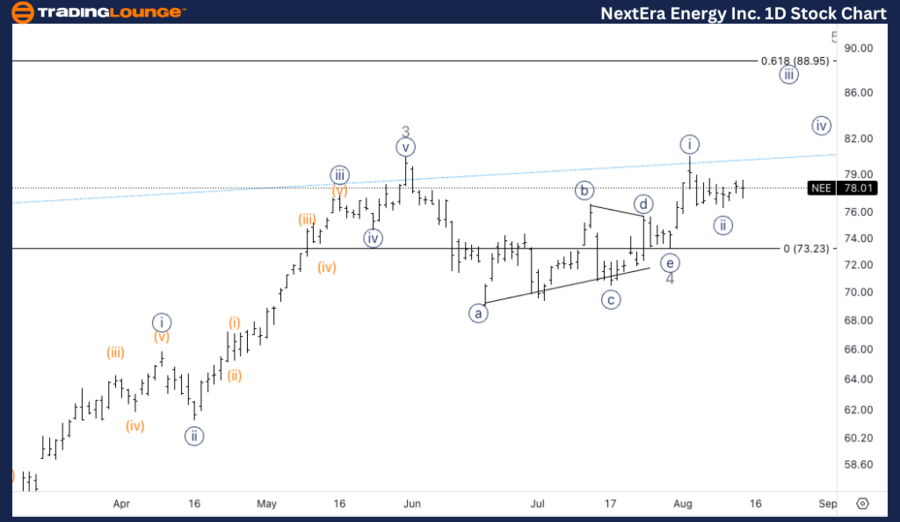
NEE Elliott Wave Analysis Trading Lounge Daily Chart,
NextEra Energy Inc., (NEE) Daily Chart.
NEE Elliott Wave technical analysis
Function: Trend.
Mode: Impulsive.
Structure: Motive.
Position: Wave {i} of 5.
Direction: Upside in wave {iii}.
Details: We are looking at what could be a bottom in wave {ii}, and we are forecasting further upside into wave {iii} of 5 to start trading above TL8 at 80$.
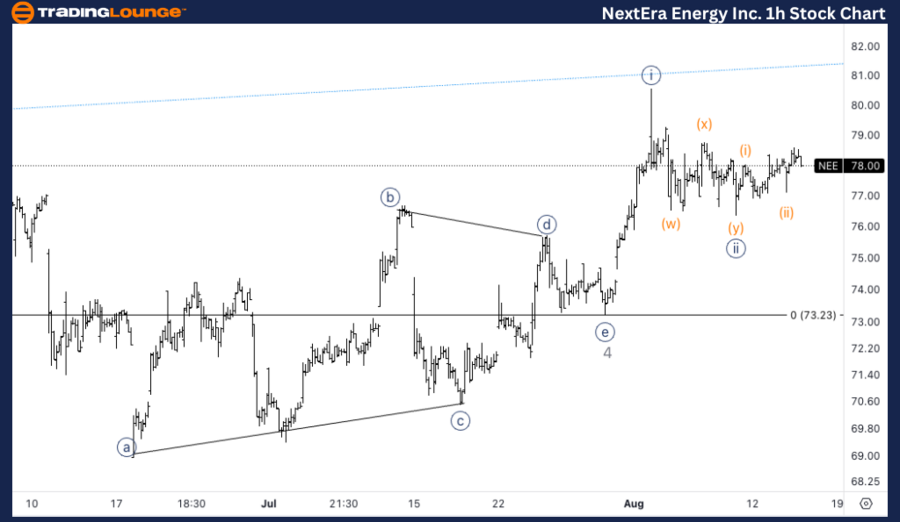
NEE Elliott Wave Analysis Trading Lounge 4H Chart,
NextEra Energy Inc., (NEE) 4H Chart.
NEE Elliott Wave technical analysis
Function: Trend.
Mode: Impulsive.
Structure: Motive.
Position: Wave (iii) of {iii}.
Direction: Upside in (iii).
Details: Looking for acceleration higher in what could be wave (iii) of {iii}. If not, we could still be correcting within wave {ii}.
Welcome to our latest Elliott Wave analysis for NextEra Energy Inc. (NEE) as of August 15, 2024. This analysis delves into NEE's price movements utilizing the Elliott Wave Theory, providing traders with insights into potential trading opportunities based on current trends and market structure. We will cover both the daily and 4-hour charts to present a comprehensive view of NEE's market behavior.
NEE Elliott Wave technical analysis – Daily chart
NEE appears to have found a bottom in wave {ii}, indicating the potential for further upside as wave {iii} of 5 begins to unfold. The focus is on breaking and sustaining trading above Trendline 8 (TL8) at $80, which would confirm the start of wave {iii} and likely lead to accelerated gains as the wave progresses.
NEE Elliott Wave technical analysis – Four-hour chart
NEE is anticipated to accelerate higher within wave (iii) of {iii}. If this acceleration materializes, it would confirm that wave {iii} is indeed in progress. However, there remains a possibility that the price could still be correcting within wave {ii}, in which case further consolidation may occur before the next upward move.
Technical analyst: Alessio Barretta.
NEE Elliott Wave technical analysis [Video]
Author

Peter Mathers
TradingLounge
Peter Mathers started actively trading in 1982. He began his career at Hoei and Shoin, a Japanese futures trading company.


