NEE Elliott Wave technical analysis

Function: Counter Trend.

Mode: Corrective.

Structure: Flat.

Position: Minor wave 4.

Direction: Bottom in place at wave 4.

Details: We are looking for a minor wave 4 formation, with support identified around $72.

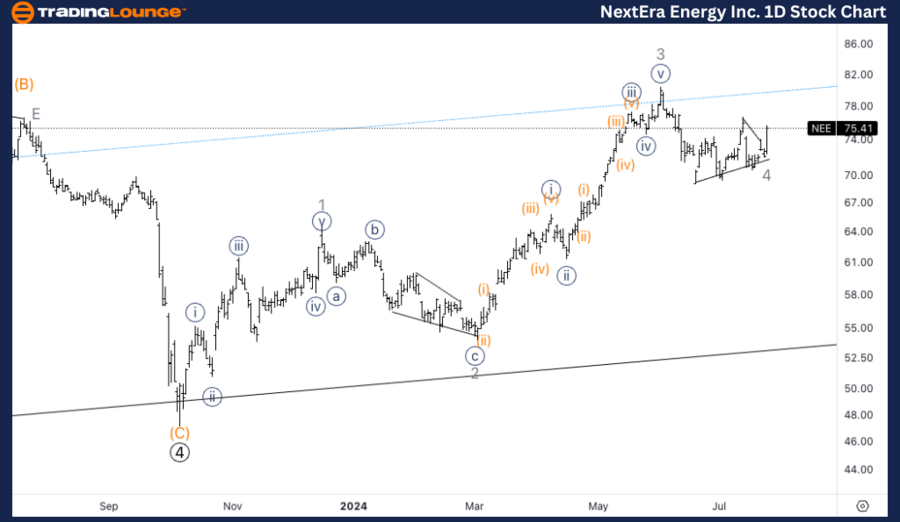
NEE Elliott Wave technical analysis – Daily chart

The daily chart indicates that Minor wave 4 has likely found support near the $72 mark. This level is critical as it suggests that the corrective phase might be concluding, paving the way for the next upward movement. Traders should observe this support level for confirmation of a bottom.

Chart

NEE Elliott Wave technical analysis

Function: Counter Trend

Mode: Corrective

Structure: Flat

Position: Minor wave 4

Direction: Bottom in place at wave 4.

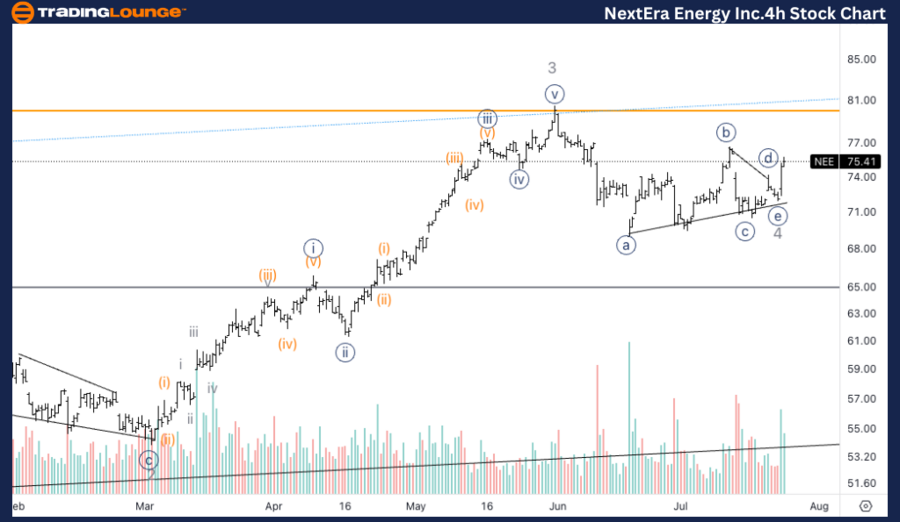
Details: The 4-hour chart shows a potential triangle in wave 4, suggesting a bottom formation and possible resumption of upward movement.

NEE Elliott Wave technical analysis – Four-hour chart

The 4-hour chart offers a closer examination of the subdivision within wave 4, indicating a potential triangle formation. This pattern suggests that wave 4 may have reached its bottom and that an upward trend could already be starting. Traders should watch for a breakout from this triangle to confirm the continuation of the upward movement.

Chart

Welcome to our latest Elliott Wave analysis for NextEra Energy Inc. (NEE). This analysis provides a detailed overview of NEE's price trends using Elliott Wave Theory, helping traders identify potential trading opportunities based on current market behavior. We will explore insights from both the daily and 4-hour charts to provide a comprehensive perspective on NEE's price action.

NextEra Energy Inc. (NEE) Elliott Wave technical analysis [Video]

Share: Feed news

As with any investment opportunity there is a risk of making losses on investments that Trading Lounge expresses opinions on.

Historical results are no guarantee of future returns. Some investments are inherently riskier than others. At worst, you could lose your entire investment. TradingLounge™ uses a range of technical analysis tools, software and basic fundamental analysis as well as economic forecasts aimed at minimizing the potential for loss.

The advice we provide through our TradingLounge™ websites and our TradingLounge™ Membership has been prepared without considering your objectives, financial situation or needs. Reliance on such advice, information or data is at your own risk. The decision to trade and the method of trading is for you alone to decide. This information is of a general nature only, so you should, before acting upon any of the information or advice provided by us, consider the appropriateness of the advice considering your own objectives, financial situation or needs. Therefore, you should consult your financial advisor or accountant to determine whether trading in securities and derivatives products is appropriate for you considering your financial circumstances.

Recommended content


Recommended content

Editors’ Picks

EUR/USD stays in positive territory above 1.0850 after US data

EUR/USD stays in positive territory above 1.0850 after US data

EUR/USD clings to modest daily gains above 1.0850 in the second half of the day on Friday. The improving risk mood makes it difficult for the US Dollar to hold its ground after PCE inflation data, helping the pair edge higher ahead of the weekend.

EUR/USD News

GBP/USD stabilizes above 1.2850 as risk mood improves

GBP/USD stabilizes above 1.2850 as risk mood improves

GBP/USD maintains recovery momentum and fluctuates above 1.2850 in the American session on Friday. The positive shift seen in risk mood doesn't allow the US Dollar to preserve its strength and supports the pair.

GBP/USD News

Gold rebounds above $2,380 as US yields stretch lower

Gold rebounds above $2,380 as US yields stretch lower

Following a quiet European session, Gold gathers bullish momentum and trades decisively higher on the day above $2,380. The benchmark 10-year US Treasury bond yield loses more than 1% on the day after US PCE inflation data, fuelling XAU/USD's upside.

Gold News

Avalanche price sets for a rally following retest of key support level

Avalanche price sets for a rally following retest of  key support level

Avalanche (AVAX) price bounced off the $26.34 support level to trade at $27.95 as of Friday. Growing on-chain development activity indicates a potential bullish move in the coming days.

Read more

The election, Trump's Dollar policy, and the future of the Yen

The election, Trump's Dollar policy, and the future of the Yen

After an assassination attempt on former President Donald Trump and drop out of President Biden, Kamala Harris has been endorsed as the Democratic candidate to compete against Trump in the upcoming November US presidential election.

Read more

Forex MAJORS

Cryptocurrencies

Signatures