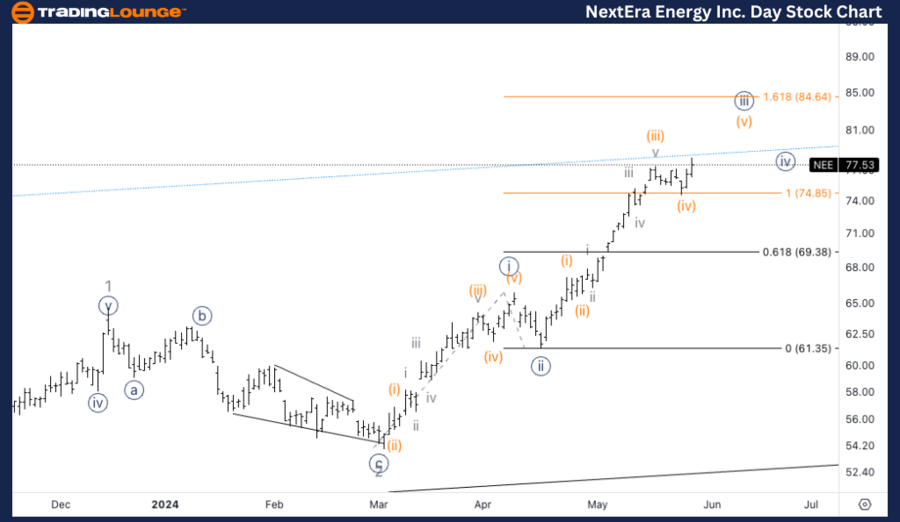
NextEra Energy Inc., (NEE) Daily Chart

NEE Elliott Wave technical analysis

Function: Trend.

Mode: Impulsive.

Structure: Motive.

Position: Minor 3.  

Direction: Top in 3.  

Details: Looking for a three wave move in wave 2 to be soon completed, to then continue higher.  Looking for Minor wave 3 to keep unfolding into a clear five wave move, the next level of resistance will be TL8 at 80$.  

NEE Elliott Wave technical analysis – Daily chart

In our Elliott Wave analysis of NextEra Energy Inc. (NEE) on May 29, 2024, we observe an impulsive trend characterized by a motive structure. NEE is currently positioned in Minor wave 3, indicating a top in wave 3. We anticipate a three-wave move in wave 2 to be completed soon, after which the trend should continue higher. As Minor wave 3 unfolds into a clear five-wave move, traders should look for the next level of resistance at TL8 around $80. Monitoring this level can provide confirmation of the ongoing bullish trend.

NEE


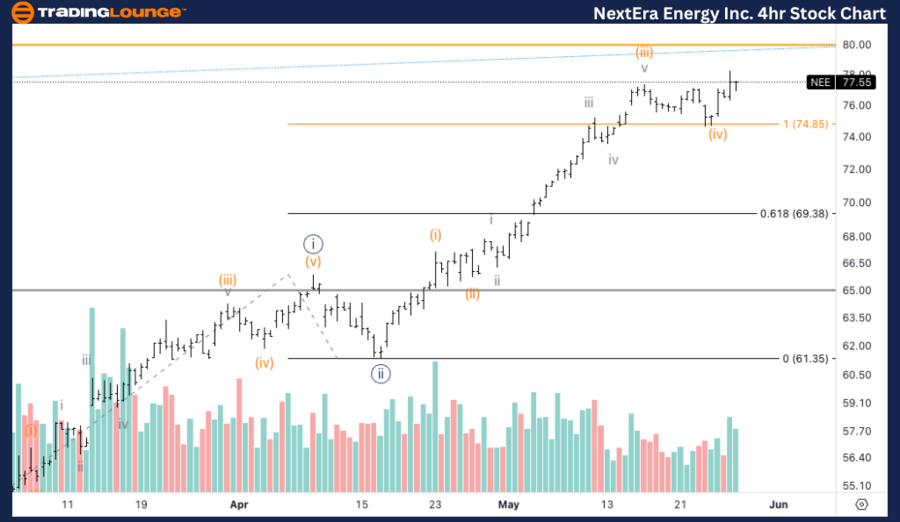
NEE Elliott Wave technical analysis – Four-hour chart

On the 4-hour chart, NEE is following an impulsive trend within a motive structure, specifically in wave (v) of {iii}. The current analysis indicates that we are looking for further upside in wave (v), with volume confirming the bullish move. The equality of wave {iii} vs. {i} has already been surpassed at $75, with the 1.618 extension standing at $84. Traders should watch for potential resistance around this level, which could offer strategic opportunities for profit-taking or positioning for further upside.

Function: Trend.

Mode: Impulsive.

Structure: Motive.  

Position: Wave (v) of {iii}.

Direction: Upside in (v).

Details: Looking for upside into wave (v), volume confirm the bullish move, and we have equality of {iii} vs. {i} already surpassed at 75$, 1.618 stands at 84$.

Chart

NextEra Energy Inc.(NEE) Elliott Wave technical analysis [Video]

Share: Feed news

As with any investment opportunity there is a risk of making losses on investments that Trading Lounge expresses opinions on.

Historical results are no guarantee of future returns. Some investments are inherently riskier than others. At worst, you could lose your entire investment. TradingLounge™ uses a range of technical analysis tools, software and basic fundamental analysis as well as economic forecasts aimed at minimizing the potential for loss.

The advice we provide through our TradingLounge™ websites and our TradingLounge™ Membership has been prepared without considering your objectives, financial situation or needs. Reliance on such advice, information or data is at your own risk. The decision to trade and the method of trading is for you alone to decide. This information is of a general nature only, so you should, before acting upon any of the information or advice provided by us, consider the appropriateness of the advice considering your own objectives, financial situation or needs. Therefore, you should consult your financial advisor or accountant to determine whether trading in securities and derivatives products is appropriate for you considering your financial circumstances.

Recommended content


Recommended content

Editors’ Picks

AUD/USD: The hunt for the 0.7000 hurdle

AUD/USD: The hunt for the 0.7000 hurdle

AUD/USD quickly left behind Wednesday’s strong pullback and rose markedly past the 0.6900 barrier on Thursday, boosted by news of fresh stimulus in China as well as renewed weakness in the US Dollar.

AUD/USD News
EUR/USD refocuses its attention to 1.1200 and above

EUR/USD refocuses its attention to 1.1200 and above

Rising appetite for the risk-associated assets, the offered stance in the Greenback and Chinese stimulus all contributed to the resurgence of the upside momentum in EUR/USD, which managed to retest the 1.1190 zone on Thursday.

EUR/USD News
Gold holding at higher ground at around $2,670

Gold holding at higher ground at around $2,670

Gold breaks to new high of $2,673 on Thursday. Falling interest rates globally, intensifying geopolitical conflicts and heightened Fed easing bets are the main factors. 

Gold News
Bitcoin displays bullish signals amid supportive macroeconomic developments and growing institutional demand

Bitcoin displays bullish signals amid supportive macroeconomic developments and growing institutional demand

Bitcoin (BTC) trades slightly up, around $64,000 on Thursday, following a rejection from the upper consolidation level of $64,700 the previous day. BTC’s price has been consolidating between $62,000 and $64,700 for the past week.

Read more
RBA widely expected to keep key interest rate unchanged amid persisting price pressures

RBA widely expected to keep key interest rate unchanged amid persisting price pressures

The Reserve Bank of Australia is likely to continue bucking the trend adopted by major central banks of the dovish policy pivot, opting to maintain the policy for the seventh consecutive meeting on Tuesday.

Read more
Five best Forex brokers in 2024

Five best Forex brokers in 2024

VERIFIED Choosing the best Forex broker in 2024 requires careful consideration of certain essential factors. With the wide array of options available, it is crucial to find a broker that aligns with your trading style, experience level, and financial goals. 

Read More

Forex MAJORS

Cryptocurrencies

Signatures