Unlocking ASX Trading Success: NEWMONT CORPORATION – NEM Stock Analysis & Elliott Wave Technical Forecast

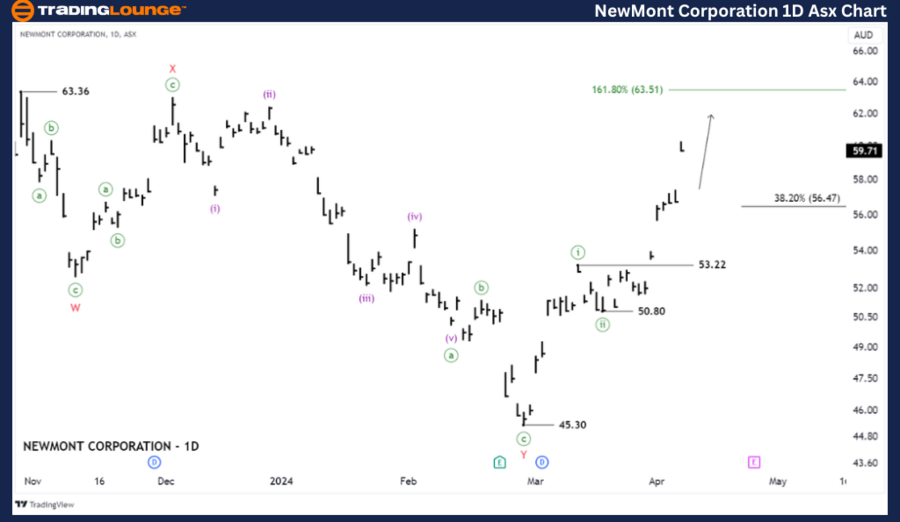
ASX: NEWMONT CORPORATION – NEM Elliott Elliott Wave Technical Analysis TradingLounge (1D Chart)

Greetings, Our Elliott Wave analysis today updates the Australian Stock Exchange (ASX) with NEWMONT CORPORATION – NEM. In our Top 50 ASX Stocks analysis service, we accurately forecasted the opportunity for NEM to rise from around AUD $53.50, and significant profits have since been realized. At this point, we still maintain our previous outlook for NEM to continue pushing higher, aiming for the immediate target at 63.51.

ASX: NEM Elliott Wave technical analysis  

Function: Major trend (Minute degree, green).

Mode: Motive.

Structure: Impulse.

Position: Wave ((iii))-greenLast Forecast: The most recent forecast was correct.

Details: The context suggests that a Five-waves pattern is seemingly unfolding from the low at 45.30, allowing NEM to rise further. Wave ((i))-green has peaked, and wave ((ii))-green has opened, while wave ((iii))-green appears poised to rise higher towards the target at 63.51 and prices consistently remaining above the low at 50.80,
Invalidation point: 45.30.

Chart

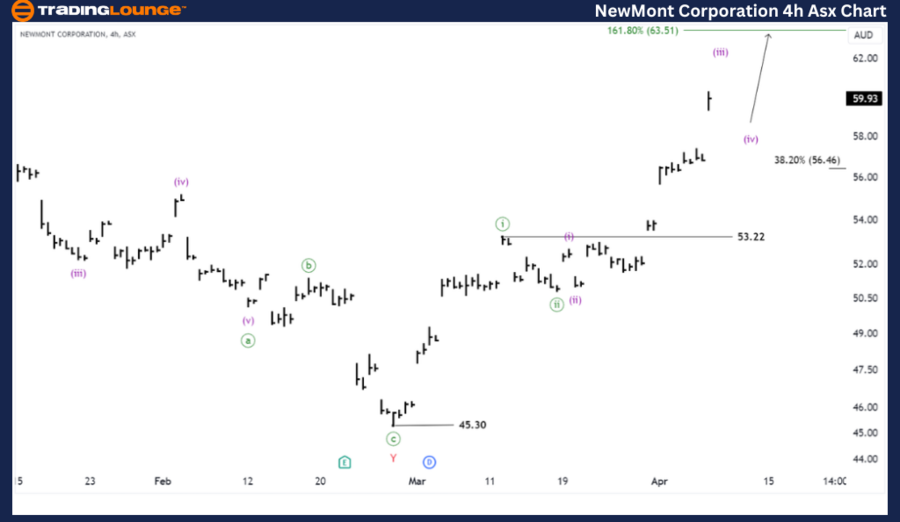
ASX: NEM four-hour chart analysis

Function: Major trend (Minute degree, green).

Mode: Motive.

Structure: Impulse.

Position: Wave (iii)-purple of Wave ((iii))-green.

Last forecast: The most recent forecast was correct.

Details: The short-term outlook further indicates that wave ((iii))-green has opened up and is pushing higher towards the target at 63.51. It subdivides into waves (i)-purple to (iii)-purple, while the price must remain above 56.46, as this is a potential support level for this upward trend. A decrease below this level suggests wave (iv) or ((iv)) is unfolding, followed by the return of wave five to continue pushing higher.

Invalidation point: 53.22

Chart

Conclusion

Our analysis, forecast of contextual trends, and short-term outlook for ASX: NEWMONT CORPORATION – NEM aim to provide readers with insights into the current market trends and how to capitalize on them effectively. We offer specific price points that act as validation or invalidation signals for our wave count, enhancing the confidence in our perspective. By combining these factors, we strive to offer readers the most objective and professional perspective on market trends.

Newmont Corporation Elliott Wave technical forecast [Video]

Share: Feed news

As with any investment opportunity there is a risk of making losses on investments that Trading Lounge expresses opinions on.

Historical results are no guarantee of future returns. Some investments are inherently riskier than others. At worst, you could lose your entire investment. TradingLounge™ uses a range of technical analysis tools, software and basic fundamental analysis as well as economic forecasts aimed at minimizing the potential for loss.

The advice we provide through our TradingLounge™ websites and our TradingLounge™ Membership has been prepared without considering your objectives, financial situation or needs. Reliance on such advice, information or data is at your own risk. The decision to trade and the method of trading is for you alone to decide. This information is of a general nature only, so you should, before acting upon any of the information or advice provided by us, consider the appropriateness of the advice considering your own objectives, financial situation or needs. Therefore, you should consult your financial advisor or accountant to determine whether trading in securities and derivatives products is appropriate for you considering your financial circumstances.

Recommended content


Recommended content

Editors’ Picks

AUD/USD: Next on tap comes the 200-day SMA

AUD/USD: Next on tap comes the 200-day SMA

There was no respite for the downside pressure in AUD/USD on Wednesday, as spot retreated for the fifth day in a row and challenged the key support region around 0.6700 on the back of the unabated upside pressure in the US Dollar.

AUD/USD News
EUR/USD: Extra retracements appear in the pipeline

EUR/USD: Extra retracements appear in the pipeline

EUR/USD rapidly left behind two consecutive daily advances and tumbled to new two-day lows near 1.0930 in response to the continuation of the buying interest in the Greenback prior to the release of US CPI data on Thursday.

EUR/USD News
Gold loses its shine, approaches $2,600

Gold loses its shine, approaches $2,600

Spot Gold fell to $2,604.66 on Tuesday, bouncing modestly afterwards. The XAU/USD pair nears such a low early in the American session as investors await the FOMC Meeting Minutes and Fedspeak.

Gold News
Crypto Today: Bitcoin, Ethereum, XRP stay put as market faces potential supply overhang from Bitfinex and US

Crypto Today: Bitcoin, Ethereum, XRP stay put as market faces potential supply overhang from Bitfinex and US

BTC/USD (Source: Peter Brandt via X) According to popular trader Peter Brandt, Bitcoin could rally to $135,000 in August/September 2025 as the top digital asset often starts posting significant gains in post-half of halving cycles.

Read more
RBA widely expected to keep key interest rate unchanged amid persisting price pressures

RBA widely expected to keep key interest rate unchanged amid persisting price pressures

The Reserve Bank of Australia is likely to continue bucking the trend adopted by major central banks of the dovish policy pivot, opting to maintain the policy for the seventh consecutive meeting on Tuesday.

Read more
Five best Forex brokers in 2024

Five best Forex brokers in 2024

VERIFIED Choosing the best Forex broker in 2024 requires careful consideration of certain essential factors. With the wide array of options available, it is crucial to find a broker that aligns with your trading style, experience level, and financial goals. 

Read More

Forex MAJORS

Cryptocurrencies

Signatures