In this technical article we’re going to take a quick look at the Elliott Wave charts of Netflix Stock (NFLX), published in members area of the website. As our members are aware, NFLX recently completed a correction against the 583.7 low. We saw a clear 3-wave pullback, wave (4), followed by the expected rally. In this post, we will explain the Elliott Wave count in detail.
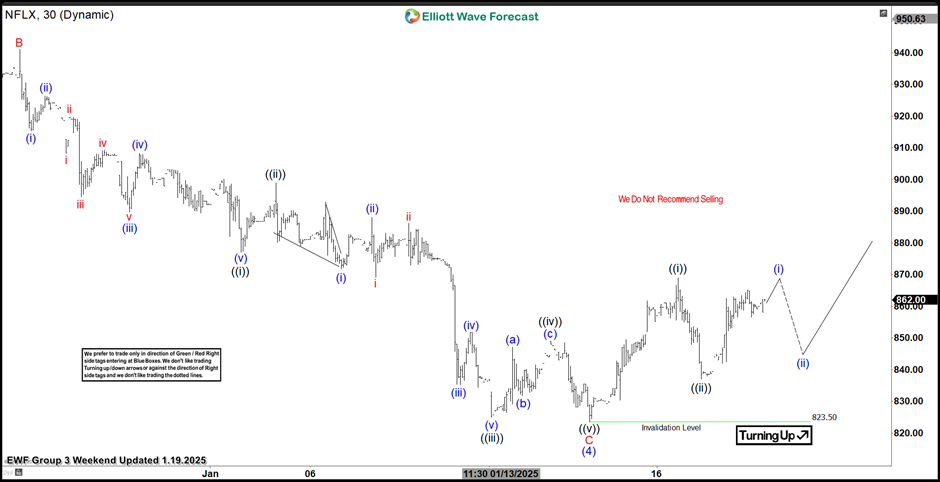
NFLX H1 weekend 01.19.2025
The current view suggests that Netflix stock completed a 3-wave pullback from the peak to the low, labeled as wave (4) blue. A rally followed from this low, appearing impulsive. We have labeled this short-term cycle as wave ((i)) black, marking the start of a new bullish cycle. We expect Netflix stock to continue attracting intraday buyers in 3, 7, and 11 swings, as long as the price stays above ((ii)), and more importantly, above the (4) blue low of 823.5.
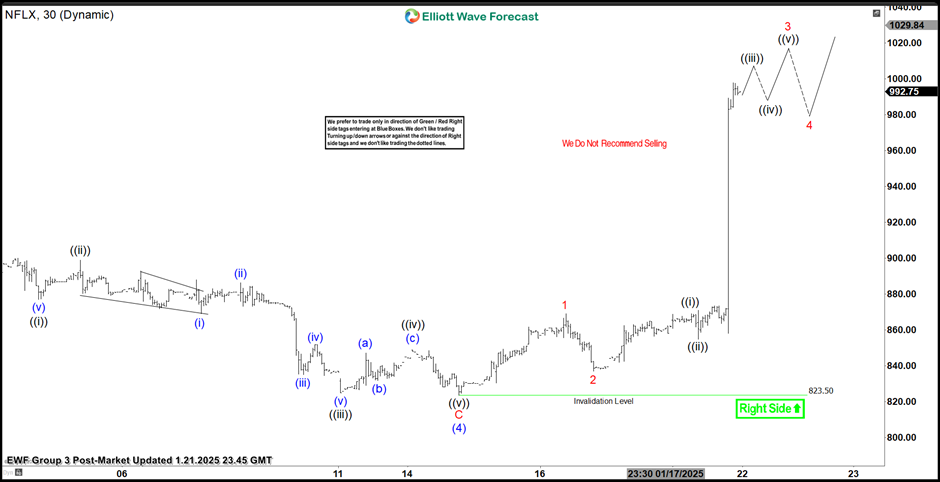
NFLX H1 post-market 01.21.2025
Netflix held above the 823.5 low as expected and made a sharp rally toward new highs. The structure from the 823.5 low looks impulsive. We believe this rally is wave ((iii)) of 3, known among Elliott Wave practitioners as the strongest wave. At some point, we expect a 3-wave pullback in wave 4 (red), which should present new buying opportunities.
FURTHER DISCLOSURES AND DISCLAIMER CONCERNING RISK, RESPONSIBILITY AND LIABILITY Trading in the Foreign Exchange market is a challenging opportunity where above average returns are available for educated and experienced investors who are willing to take above average risk. However, before deciding to participate in Foreign Exchange (FX) trading, you should carefully consider your investment objectives, level of xperience and risk appetite. Do not invest or trade capital you cannot afford to lose. EME PROCESSING AND CONSULTING, LLC, THEIR REPRESENTATIVES, AND ANYONE WORKING FOR OR WITHIN WWW.ELLIOTTWAVE- FORECAST.COM is not responsible for any loss from any form of distributed advice, signal, analysis, or content. Again, we fully DISCLOSE to the Subscriber base that the Service as a whole, the individual Parties, Representatives, or owners shall not be liable to any and all Subscribers for any losses or damages as a result of any action taken by the Subscriber from any trade idea or signal posted on the website(s) distributed through any form of social-media, email, the website, and/or any other electronic, written, verbal, or future form of communication . All analysis, trading signals, trading recommendations, all charts, communicated interpretations of the wave counts, and all content from any media form produced by www.Elliottwave-forecast.com and/or the Representatives are solely the opinions and best efforts of the respective author(s). In general Forex instruments are highly leveraged, and traders can lose some or all of their initial margin funds. All content provided by www.Elliottwave-forecast.com is expressed in good faith and is intended to help Subscribers succeed in the marketplace, but it is never guaranteed. There is no “holy grail” to trading or forecasting the market and we are wrong sometimes like everyone else. Please understand and accept the risk involved when making any trading and/or investment decision. UNDERSTAND that all the content we provide is protected through copyright of EME PROCESSING AND CONSULTING, LLC. It is illegal to disseminate in any form of communication any part or all of our proprietary information without specific authorization. UNDERSTAND that you also agree to not allow persons that are not PAID SUBSCRIBERS to view any of the content not released publicly. IF YOU ARE FOUND TO BE IN VIOLATION OF THESE RESTRICTIONS you or your firm (as the Subscriber) will be charged fully with no discount for one year subscription to our Premium Plus Plan at $1,799.88 for EACH person or firm who received any of our content illegally through the respected intermediary’s (Subscriber in violation of terms) channel(s) of communication.
Recommended content
Editors’ Picks

Gold hovers around all-time highs near $3,250
Gold is holding steady near the $3,250 mark, fuelled by robust safe-haven demand, trade war concerns, and a softer-than-expected US inflation gauge. The US Dollar keeps trading with heavy losses around three-year lows.

EUR/USD retreats towards 1.1300 as Wall Street shrugs off trade war headlines
The EUR/USD pair retreated further from its recent multi-month peak at 1.1473 and trades around the 1.1300 mark. Wall Street manages to advance ahead of the weekly close, despite escalating tensions between Washington and Beijing and mounting fears of a US recession. Profit-taking ahead of the close also weighs on the pair.

GBP/USD trims gains, recedes to the 1.3050 zone
GBP/USD now gives away part of the earlier advance to fresh highs near 1.3150. Meanwhile, the US Dollar remains offered amid escalating China-US trade tensions, recession fears in the US, and softer-than-expected US Producer Price data.

Bitcoin, Ethereum, Dogecoin and Cardano stabilze – Why crypto is in limbo
Bitcoin, Ethereum, Dogecoin and Cardano stabilize on Friday as crypto market capitalization steadies around $2.69 trillion. Crypto traders are recovering from the swing in token prices and the Monday bloodbath.

Is a recession looming?
Wall Street skyrockets after Trump announces tariff delay. But gains remain limited as Trade War with China continues. Recession odds have eased, but investors remain fearful. The worst may not be over, deeper market wounds still possible.

The Best brokers to trade EUR/USD
SPONSORED Discover the top brokers for trading EUR/USD in 2025. Our list features brokers with competitive spreads, fast execution, and powerful platforms. Whether you're a beginner or an expert, find the right partner to navigate the dynamic Forex market.