Netflix Inc. (NFLX) Elliott Wave technical analysis [Video]
![Netflix Inc. (NFLX) Elliott Wave technical analysis [Video]](https://editorial.fxstreet.com/images/Markets/Equities/Industries/Media/Netflix_XtraLarge.jpg)
NFLX Elliott Wave Analysis Trading Lounge.
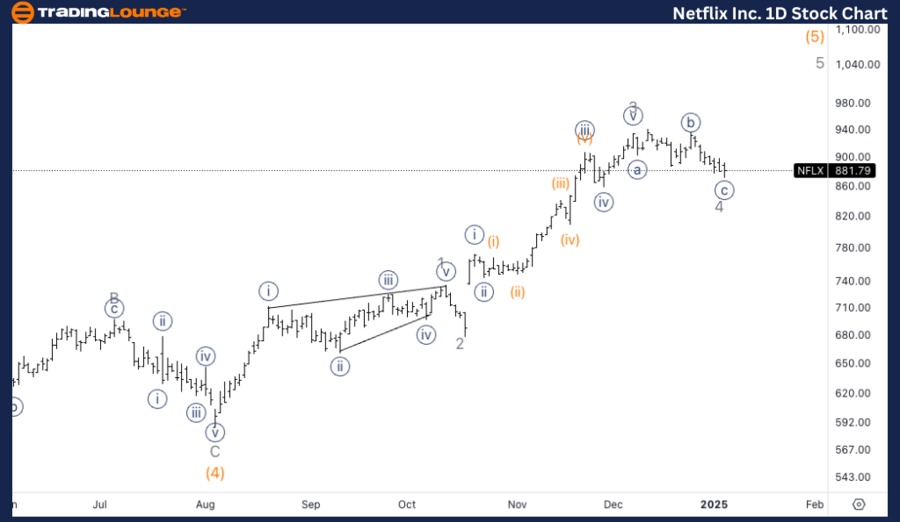
Netflix Inc., (NFLX) daily chart.
NFLX Elliott Wave technical analysis
Function: Trend.
Mode: Impulsive.
Structure: Motive.
Position: Wave 4 of (5).
Direction: Upside within wave 5 of (5).
Details: Looking for a bottom in wave 4 in place or soon to be. Wave 3 is just a bit short of 1.618 3 vs. 1, looking for overall upside towards TradingLevel1 at 1000$.
NFLX Elliott Wave technical analysis – Daily chart
Netflix is currently in Wave 4 of the larger wave (5). The correction within wave 4 is nearing completion, and we expect to see a bottom either already in place or forming soon. Wave 3 nearly reached the 1.618 extension of wave 3 vs. wave 1, indicating strong momentum in the previous move. The next move will likely be upside into wave 5 of (5), with the target around TradingLevel1 at 1000$.
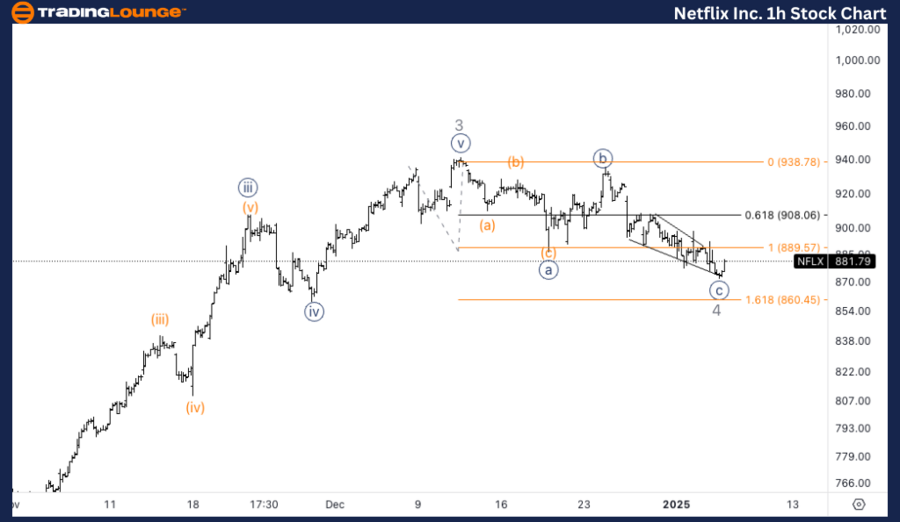
Netflix Inc., (NFLX) one-hour chart.
NFLX Elliott Wave technical analysis
Function: Trend
Mode: Impulsive
Structure: Motive
Position: Wave {c} of 4.
Direction: Bottom in wave {c}.
Details: We seem to be close to a bottom in wave {c} as we have met equality of {c} vs. {a} at 889$. Looking for a turn higher to start having confirmation.
NFLX Elliott Wave technical analysis – One-hour chart
On the 1-hour chart, we are tracking the completion of wave {c} of 4. The price has already hit equality of {c} vs. {a} at 889$, suggesting that a bottom is near or may already be in place. Confirmation of a bullish reversal will come when we see a strong turn higher, which would initiate wave 5.
In this Elliott Wave analysis, we will review the trend structure of Netflix Inc., (NFLX) using both the daily and 1-hour charts to assess the current wave position and potential price movements.
Netflix Inc. (NFLX) Elliott Wave technical analysis [Video]
Author

Peter Mathers
TradingLounge
Peter Mathers started actively trading in 1982. He began his career at Hoei and Shoin, a Japanese futures trading company.


