Netflix Inc. (NFLX) Elliott Wave technical analysis [Video]
![Netflix Inc. (NFLX) Elliott Wave technical analysis [Video]](https://editorial.fxstreet.com/images/Markets/Equities/Industries/Media/Netflix_XtraLarge.jpg)
NFLX Elliott Wave technical analysis
Function: Trend.
Mode: Impulsive.
Structure: Motive.
Position: Wave 3 of (5).
Direction: Upside in wave 3.
Details: Looking for continuation higher after a leading diagonal in wave 1 and a sharp correction in wave 2.
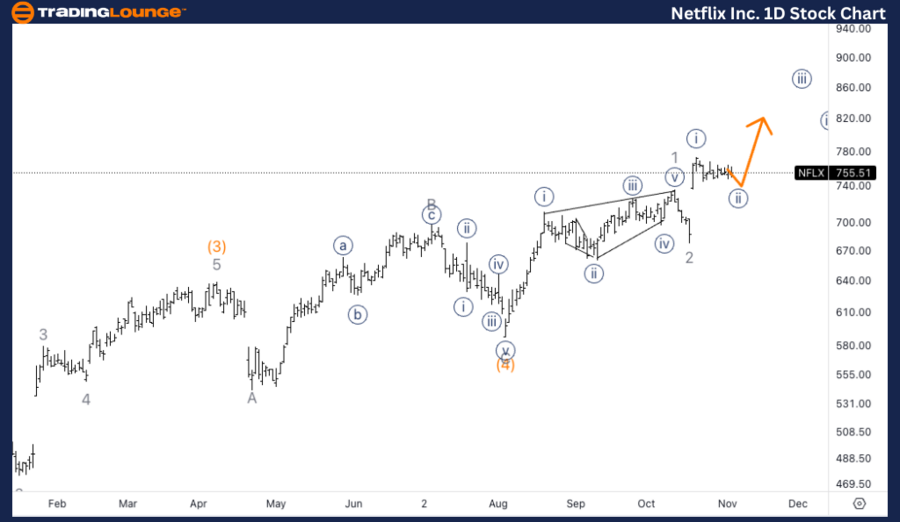
NFLX Elliott Wave technical analysis – Daily chart
On the daily chart, Netflix appears to be in wave 3 of (5) within a larger impulsive structure. After completing a leading diagonal in wave 1 followed by a sharp correction in wave 2, the expectation is for further upside in wave 3, which is typically the strongest and longest wave within an impulsive sequence.
NFLX Elliott Wave technical analysis
Function: Trend.
Mode: Impulsive.
Structure: Motive.
Position: Wave (b) of {ii}.
Direction: Bottom in wave (c).
Details: Looking for a move down in wave (c) of {ii} as we seem to be near completion of a triangle in wave (b). Equality of (c) vs. (a) stands at 735$.
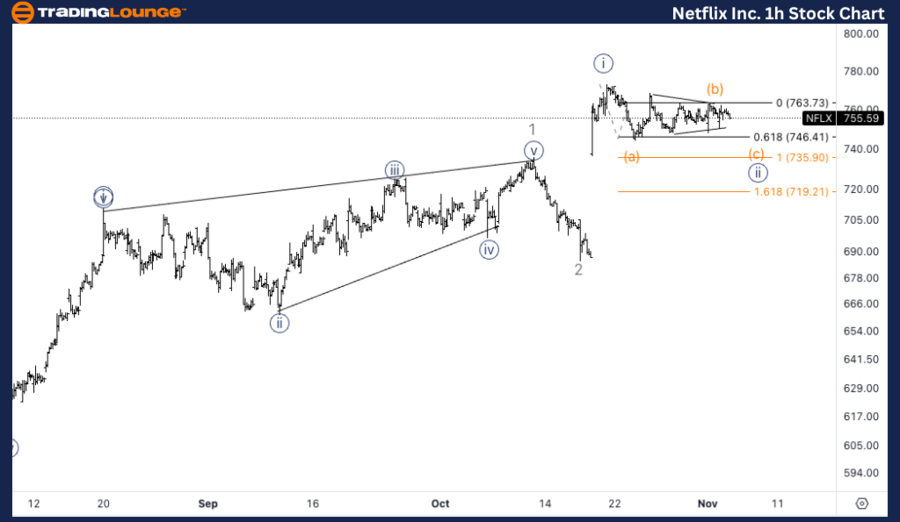
NFLX Elliott Wave technical analysis – One-hour chart
The 1-hour chart suggests that NFLX is completing a triangle in wave (b) within wave {ii}. The next move is likely a decline in wave (c) of {ii}, targeting equality between waves (c) and (a) around $735. Once wave {ii} finishes, the bullish momentum is expected to resume with a continuation higher in wave {iii}.
In this Elliott Wave analysis, we will review the trend structure of Netflix Inc., (NFLX) using both the daily and 1-hour charts to assess the current wave position and potential price movements.
Netflix Inc. (NFLX) Elliott Wave technical analysis [Video]
Author

Peter Mathers
TradingLounge
Peter Mathers started actively trading in 1982. He began his career at Hoei and Shoin, a Japanese futures trading company.


