NFLX Elliott Wave technical analysis

Function: Trend.

Mode: Impulsive.

Structure: Motive.

Position: Wave 3.

Direction: Upside in wave 3.

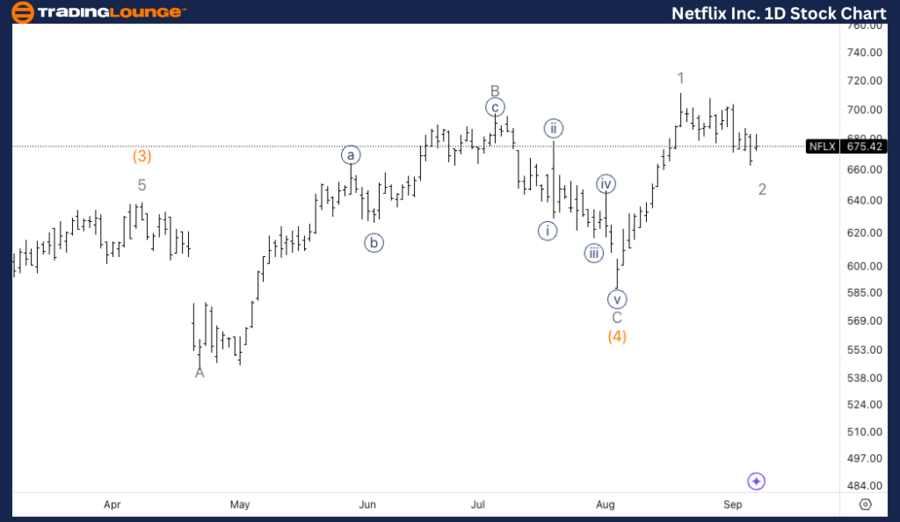
Details: Looking for upside into Minor wave 3 of Intermediate (5) as we seem to be finding support on top of 675$, which corresponds to previous ATH.

NFLX Elliott Wave technical analysis – Daily chart

In the daily chart, Netflix is currently in an impulsive upward trend, driven by a strong Motive Wave structure. The price is advancing within Minor wave 3 of the larger Intermediate wave (5), signaling bullish momentum. We are witnessing a firm wave 3 push, with the stock finding support around the $675 level, a significant price point that aligns with the previous all-time high (ATH). 

Chart

NFLX Elliott Wave technical analysis

Function: Trend.

Mode: Impulsive.

Structure: Motive.

Position: Wave {i} of 3.

Direction: Upside in wave 3.

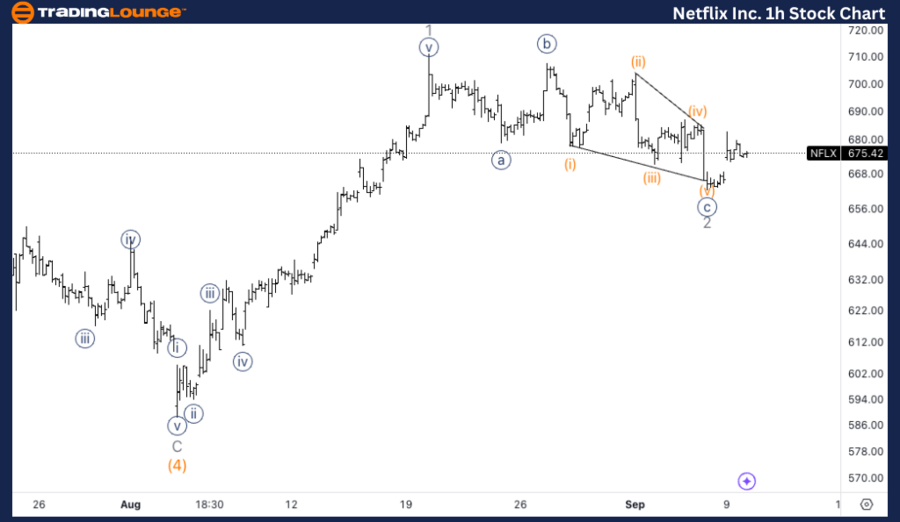
Details: Looking for a three wave move in wave 2 to be completed, as we can see a three wave move, tested support on top of 680$ will add additional confidence.

NFLX Elliott Wave technical analysis – One-hour chart

Zooming into the 1-hour chart, we observe that NFLX is in the early stages of an impulsive advance, currently moving within wave {i} of 3. The structure of the chart suggests that wave 2, a corrective wave, is in progress, but we are nearing its completion. The price action has formed a three-wave corrective move, commonly seen in Elliott Wave theory, and tested the critical support around the $680 level. This support area is vital as it adds confidence to the bullish scenario if it holds.

Chart

Welcome to our latest Elliott Wave analysis for Netflix Inc. (NFLX) as of September 10, 2024. This analysis delves into NFLX's price movements using Elliott Wave Theory, providing valuable insights for traders looking to capitalize on potential opportunities based on the current market structure and trend developments. In this article, we examine both the daily and 1-hour charts to offer a comprehensive view of NFLX’s price action.

Netflix Inc. (NFLX) Elliott Wave technical analysis [Video]


Share: Feed news

As with any investment opportunity there is a risk of making losses on investments that Trading Lounge expresses opinions on.

Historical results are no guarantee of future returns. Some investments are inherently riskier than others. At worst, you could lose your entire investment. TradingLounge™ uses a range of technical analysis tools, software and basic fundamental analysis as well as economic forecasts aimed at minimizing the potential for loss.

The advice we provide through our TradingLounge™ websites and our TradingLounge™ Membership has been prepared without considering your objectives, financial situation or needs. Reliance on such advice, information or data is at your own risk. The decision to trade and the method of trading is for you alone to decide. This information is of a general nature only, so you should, before acting upon any of the information or advice provided by us, consider the appropriateness of the advice considering your own objectives, financial situation or needs. Therefore, you should consult your financial advisor or accountant to determine whether trading in securities and derivatives products is appropriate for you considering your financial circumstances.

Recommended content


Recommended content

Editors’ Picks

EUR/USD stays below 1.1050 as mood sours

EUR/USD stays below 1.1050 as mood sours

EUR/USD struggles to stage a rebound and trades below 1.1050 on Tuesday. In the absence of high-tier macroeconomic data releases, the negative shift seen in risk mood supports the US Dollar and doesn't allow the pair to gain traction.

EUR/USD News
GBP/USD struggles to gather recovery momentum, trades below 1.3100

GBP/USD struggles to gather recovery momentum, trades below 1.3100

GBP/USD continues to fluctuate below 1.3100 in the second half of the day on Tuesday. Following a short lasting recovery attempt on UK employment data earlier in the day, the pair finds it difficult to gather momentum amid souring risk mood.

GBP/USD News
Gold trades around $2,500 as 50 bps rate cut bets dwindle

Gold trades around $2,500 as 50 bps rate cut bets dwindle

Gold is exchanging hands at around the $2,500 mark on Tuesday, sticking within its familiar range of the last few weeks as traders assess the outlook for monetary policy and the future path of interest rates in the US, a key performance indicator for Gold. 

Gold News
How the Fed's rate cuts and weakening job market impact stock trading in 2024

How the Fed's rate cuts and weakening job market impact stock trading in 2024

For the past two years, equity traders have been closely monitoring inflation reports, particularly the Consumer Price Index (CPI), as a key indicator of the Federal Reserve’s approach to managing the economy.

Read more
Dogecoin leads meme coin recovery following positive investor sentiment

Dogecoin leads meme coin recovery following positive investor sentiment

Dogecoin is up more than 8% on Monday, as it's leading the entire meme coin sector on a rebound. The top meme coin could see a massive rally if it completes a key move within a falling wedge.

Read more
Moneta Markets review 2024: All you need to know

Moneta Markets review 2024: All you need to know

VERIFIED In this review, the FXStreet team provides an independent and thorough analysis based on direct testing and real experiences with Moneta Markets – an excellent broker for novice to intermediate forex traders who want to broaden their knowledge base.

Read More

Forex MAJORS

Cryptocurrencies

Signatures