Netflix Elliott Wave technical analysis [Video]
![Netflix Elliott Wave technical analysis [Video]](https://editorial.fxstreet.com/images/Markets/Equities/Industries/Media/Netflix_XtraLarge.jpg)
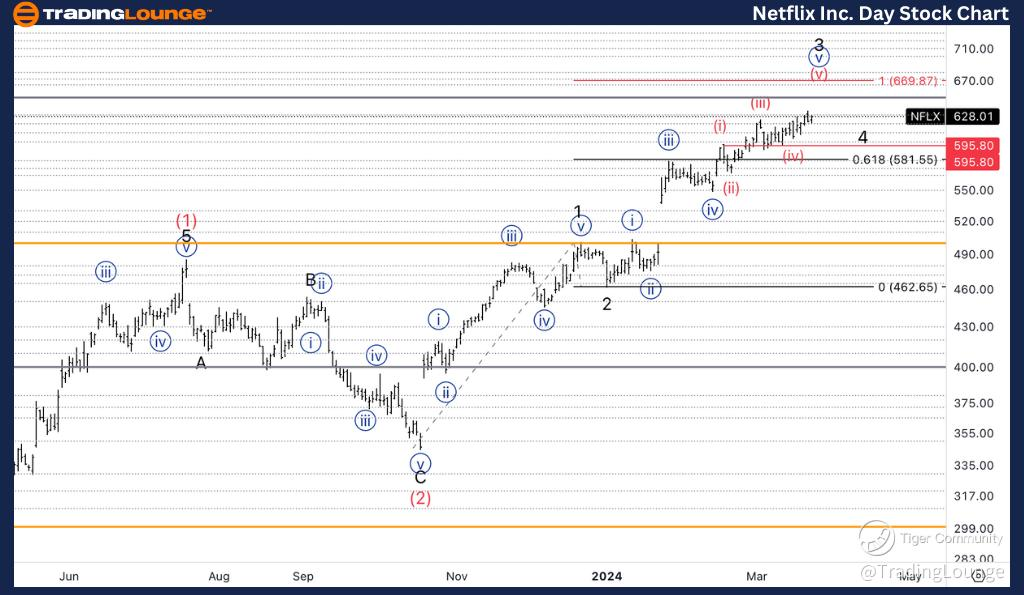
NFLX Elliott Wave technical analysis
Function: Trend
Mode: Impulsive
Structure: Motive
Position: Wave 3 of (3).
Direction: Upside in wave 3.
Details: We are approaching Medium Level at 650$ which is where we could expect wave 3 top. We also have equality of 3 vs. 1 at 670$.
NFLX Elliott Wave technical analysis – Daily chart
Our analysis reveals a trending function characterized by impulsive mode and motive structure, positioned in Wave 3 of (3). The direction indicates upside momentum in wave 3, with key levels to watch out for. We are nearing the Medium Level at $650, where a potential wave 3 top could occur. Additionally, we observe equality between wave 3 and wave 1 at $670, providing further insight into potential price targets.
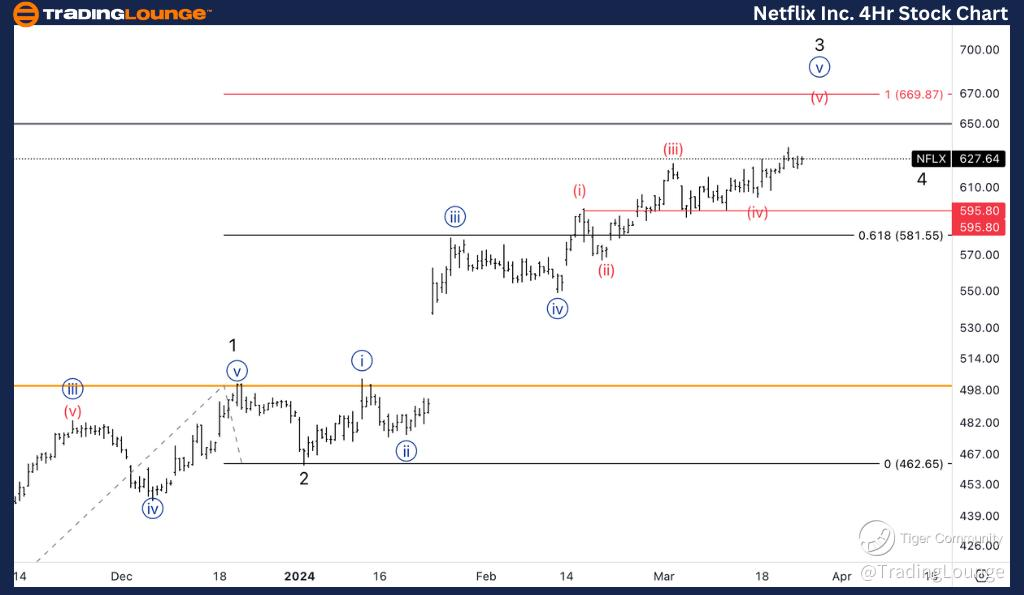
NFLX Elliott Wave technical analysis
Function: Trend.
Mode: Impulsive.
Structure: Motive.
Position: Wave (v) of {iii}.
Direction: Upside in wave (v).
Details: Looking for upside into wave (v) as we seem to have been consolidating into wave (iv).
NFLX Elliott Wave technical analysis – Four-hour chart
Here, we identify a trending function marked by impulsive mode and motive structure, positioned in Wave (v) of {iii}. The direction suggests further upside movement in wave (v) after a consolidation phase in wave (iv). This consolidation indicates a period of temporary pause before the resumption of the uptrend.
NFLX Elliott Wave technical analysis [Video]
Author

Peter Mathers
TradingLounge
Peter Mathers started actively trading in 1982. He began his career at Hoei and Shoin, a Japanese futures trading company.


