Nestle India stocks Elliott Wave technical analysis [Video]
![Nestle India stocks Elliott Wave technical analysis [Video]](https://editorial.fxstreet.com/images/Markets/Equities/Industries/Staples/pic-pexels-pixabay-256455-637435397029183920_XtraLarge.jpg)
NESTLE INDIA – NESTLEIND (1D chart) Elliott Wave technical analysis
Function: Counter Trend (Minute degree, Navy)
Mode: Corrective
Structure: Potential impulse within larger degree corrective wave
Position: Minute Wave ((i)) Navy
Details: Minute Wave ((ii)) is progressing higher towards 2500 levels, before prices turn lower again. Alternatively, the structure could be an expanded flat to terminate Minor Wave 4 within the larger degree trend higher.
Invalidation point: 2785.
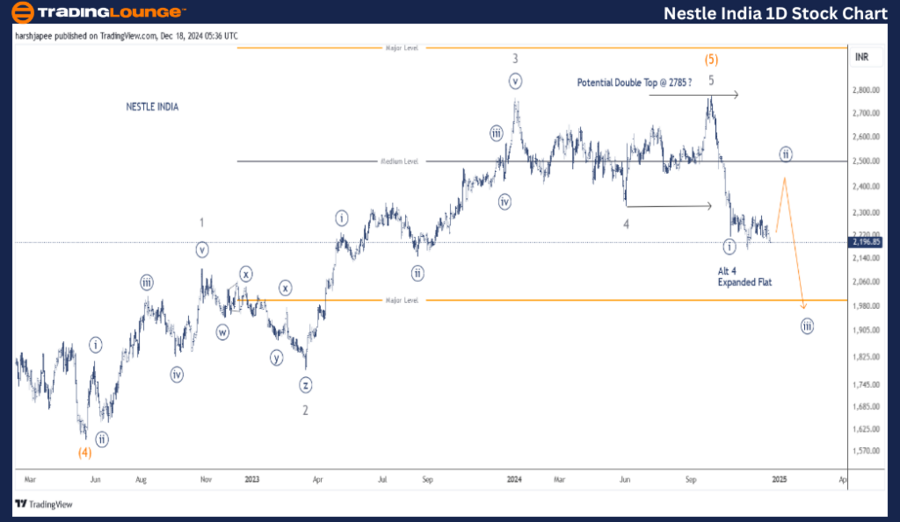
NESTLE INDIA Daily Chart Technical Analysis and potential Elliott Wave Counts:
NESTLE INDIA daily chart indicates a potential double top around 2785 as the stock reversed sharply lower through 2185 mark recently. The drop is either initial impulse drop of a larger degree correction or part of an expanded flat to terminate Minor Wave 4.
Either way, the price action suggests a potential rally from current levels towards 2450, to terminate Minute Wave ((ii)) before turning lower again. The 2785 resistance remains key for bears to remain in control.
NESTLEIND (four-hour chart) Elliott Wave technical analysis
Function: Counter Trend (Minute degree, Navy).
Mode: Corrective.
Structure: Potential impulse within larger degree corrective wave.
Position: Minute Wave ((i)) Navy.
Details: Minute Wave ((ii)) is progressing higher towards 2500 levels, before prices turn lower again. Alternatively, the structure could be an expanded flat to terminate Minor Wave 4 within the larger degree trend higher.
Invalidation point: 2785.
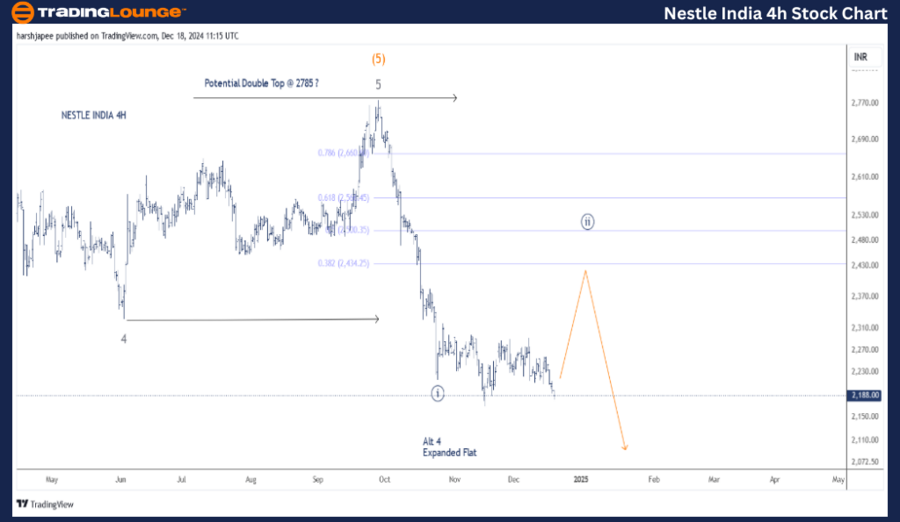
NESTLE INDIA 4H Chart Technical Analysis and potential Elliott Wave Counts:
NESTLE INDIA 4H chart is highlighting its sub-waves after Minor Wave 4 termination around 2325 mark. The rally through Wave 5 could not be clearly sub divided as an impulse but for the high probability wave count e have considered termination around 2782, a potential double top scenario.
The subsequent drop through 2215 mark looks impulsive, marked as Minute Wave ((i)). An expanded flat Wave ((ii)) is probably underway through 2440-50 zone before prices turn lower again. Alternatively, the entire drop from 2785 is a corrective expanded flat terminating Minor Wave 4 Grey around 2185 mark.
Conclusion:
NESTLE INDIA is progressing to unfold Minute Wave ((ii)) towards 2440-50, within a larger degree impulse wave lower.
Elliott Wave analyst: Harsh Japee.
NESTLEIND Elliott Wave technical analysis [Video]
Author

Peter Mathers
TradingLounge
Peter Mathers started actively trading in 1982. He began his career at Hoei and Shoin, a Japanese futures trading company.


