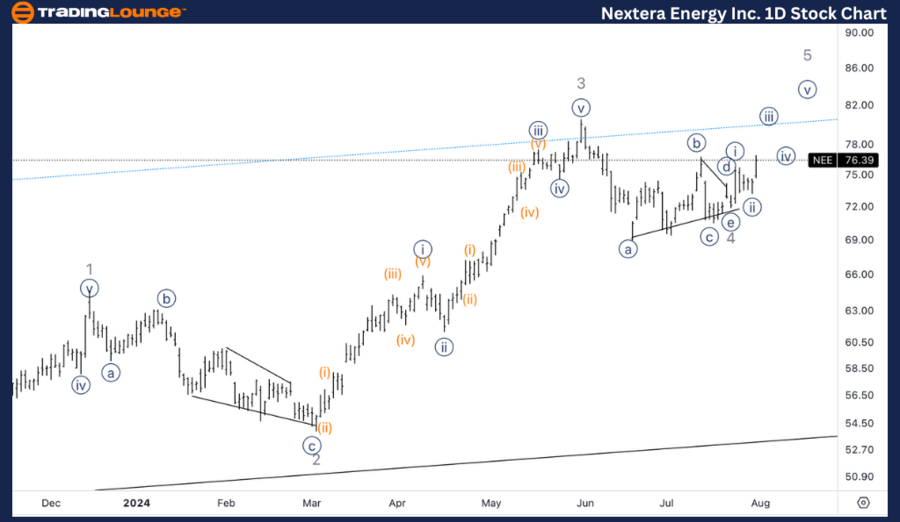
NextEra Energy Inc. (NEE) Elliott Wave Analysis - Daily Chart,
NEE Elliott Wave technical analysis
Function: Trend.
Mode: Impulsive.
Structure: Motive.
Position: Minor wave 5.
Direction: Upside in wave 5.
Details: Anticipating continuation into wave 5, with potential sub-waves {i} and {ii} already in place. Monitoring for further upward movement within wave 5.
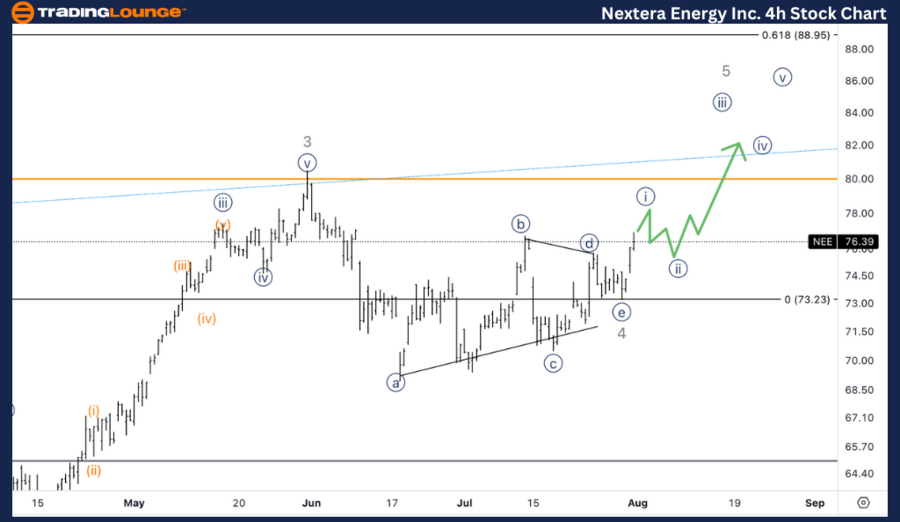
NEE Elliott Wave Analysis Trading Lounge 4H Chart,
NEE Elliott Wave Technical Analysis
Function: Trend.
Mode: Impulsive.
Structure: Motive.
Position: Minor wave 5.
Direction: Upside in wave 5.
Details: Considering the possibility of wave {i} of 5 being incomplete, suggesting potential higher upside targets. Observing 0.618 times wave 1 at around $88.
This Elliott Wave analysis for NextEra Energy Inc. (NEE) covers both daily and 4-hour charts, offering a comprehensive overview of current market positioning and potential future movements.
Technical analyst: Alessio Barretta.
NEE Elliott Wave technical analysis [Video]
As with any investment opportunity there is a risk of making losses on investments that Trading Lounge expresses opinions on.
Historical results are no guarantee of future returns. Some investments are inherently riskier than others. At worst, you could lose your entire investment. TradingLounge™ uses a range of technical analysis tools, software and basic fundamental analysis as well as economic forecasts aimed at minimizing the potential for loss.
The advice we provide through our TradingLounge™ websites and our TradingLounge™ Membership has been prepared without considering your objectives, financial situation or needs. Reliance on such advice, information or data is at your own risk. The decision to trade and the method of trading is for you alone to decide. This information is of a general nature only, so you should, before acting upon any of the information or advice provided by us, consider the appropriateness of the advice considering your own objectives, financial situation or needs. Therefore, you should consult your financial advisor or accountant to determine whether trading in securities and derivatives products is appropriate for you considering your financial circumstances.
Recommended content
Editors’ Picks
Pound Sterling weakens as BoE cuts policy rate by 25 bps to 5% – LIVE
Pound Sterling struggles to find demand on Thursday after the Bank of England (BoE) announced that it lowered the policy rate by 25 basis points to 5% in August. Market focus now shifts to BoE Governor Bailey's press conference.
EUR/USD falls below 1.0800 as US Dollar rebounds ahead of data
EUR/USD stays on the back foot and trades at fresh multi-week lows below 1.0800 on Thursday. The US Dollar finds its feet after the dovish Fed decision-led slump. Looking ahead, the US ISM Manufacturing PMI data will be the highlight.
Gold drops below $2,440 as focus shifts to US data
After climbing to a two-week high near $2,460, Gold stages a technical correction and trades in negative territory below $2,440. Following Wednesday's sharp decline, the 10-year US Treasury bond yield rebounds ahead of US data, not allowing XAU/USD to gather bullish momentum.
Bitcoin price falls to $64,000 following $3.1 billion BTC transfer by Mt. Gox
Mt. Gox moved $3.1 billion worth of BTC on Wednesday. Grayscale Mini BTC ETF receives a $1.8 billion inflow on Wednesday. The FOMC decided to hold US interest rates steady, resulting in a BTC price decline.
Now that the Fed has come and gone, what is next for markets?
Now that the dust has settled on the FOMC meeting, the market is continuing to remain bullish on US interest rate cuts for the coming months. The market is still fully priced for a September rate cut, there is a 72% chance of an October rate cut.