- Natural Gas drops near 2% on Thursday after a stellar 8% surge earlier in the week.
- Some profit-taking took place after headlines emerged that Ukraine forces entered Russia.
- The US Dollar index eases after a two-day recovery.
Natural Gas price (XNG/USD) cracks under selling pressure on Thursday after a steep surge that exceeded 8% gains over Tuesday and Wednesday. The surge came on the back of headlines that Ukrainian forces crossed the Russian border and were targeting Russian installations in the Kursk region. The risk that Russia would further limit or fully cut off the Gas supply towards Europe on the back of that news got priced in as of Tuesday.
Meanwhile, the US Dollar Index (DXY), which tracks the Greenback’s value against six major currencies, is stronger after the US Jobless Claims print. Traders were nervous as it was this same number last week that sparked the volatility patch that led to the Monday mayhen in all asset classes. The weekly US Jobless Claims data came in stronger than expected and triggered a sigh of relief in the US Dollar and equities.
Natural Gas is trading at $2.12 per MMBtu at the time of writing.
Natural Gas news and market movers: Taking Profit
- At 14:30 GMT, the weekly Natural Gas Storage Change data for the week ending August 2 will be released by the Energy Information Administration (EIA). The expectation is for a build from 18 billion to 22 billion metric tons of Natural Gas.
- The Kursk region is very gas-sensitive and holds a key Gas intake point. This might be one of the reasons why Ukraine decided to have an excursion into Russia in that specific region, according to Bloomberg.
- Temperatures are starting to ease in Egypt, which means the country's massive energy demand could end in the coming weeks.
- Bloomberg forecasts that demand for Natural Gas is set to fall further, with European storage at solid levels for the next heating season and Asian demand starting to fall month over month.
Natural Gas Technical Analysis: Snapping support
Natural Gas price might has had a nice two-day recovery, but that could be bad for Gas prices in the long run. With that brief relief rally, the Relative Strength Index (RSI) has been able to move away from being oversold in the daily chart, which means there is room now again for another leg lower. Although the $2.15 level might have been reclaimed, pressure will grow for it to snap again.
Should more bullish headlines emerge and pull Gas price higher, look ahead for moving averages as upside resistances. First, the 100-day Simple Moving Average (SMA) and the 200-day SMA near $2.35. That would already be a significant move higher, and would definitely end the losing streak from recent weeks. Further up, the 55-day SMA at $2.51 could be tested.
On the downside, pressure is building on $2.13 to a breakdown again after the brief peak above it. In case that level snaps, $2.00 comes back into play for a test and possible dip below. Although still far away, a return sub-$2.00 could mean a longer-term downward trend, with $1.53 in the cards.
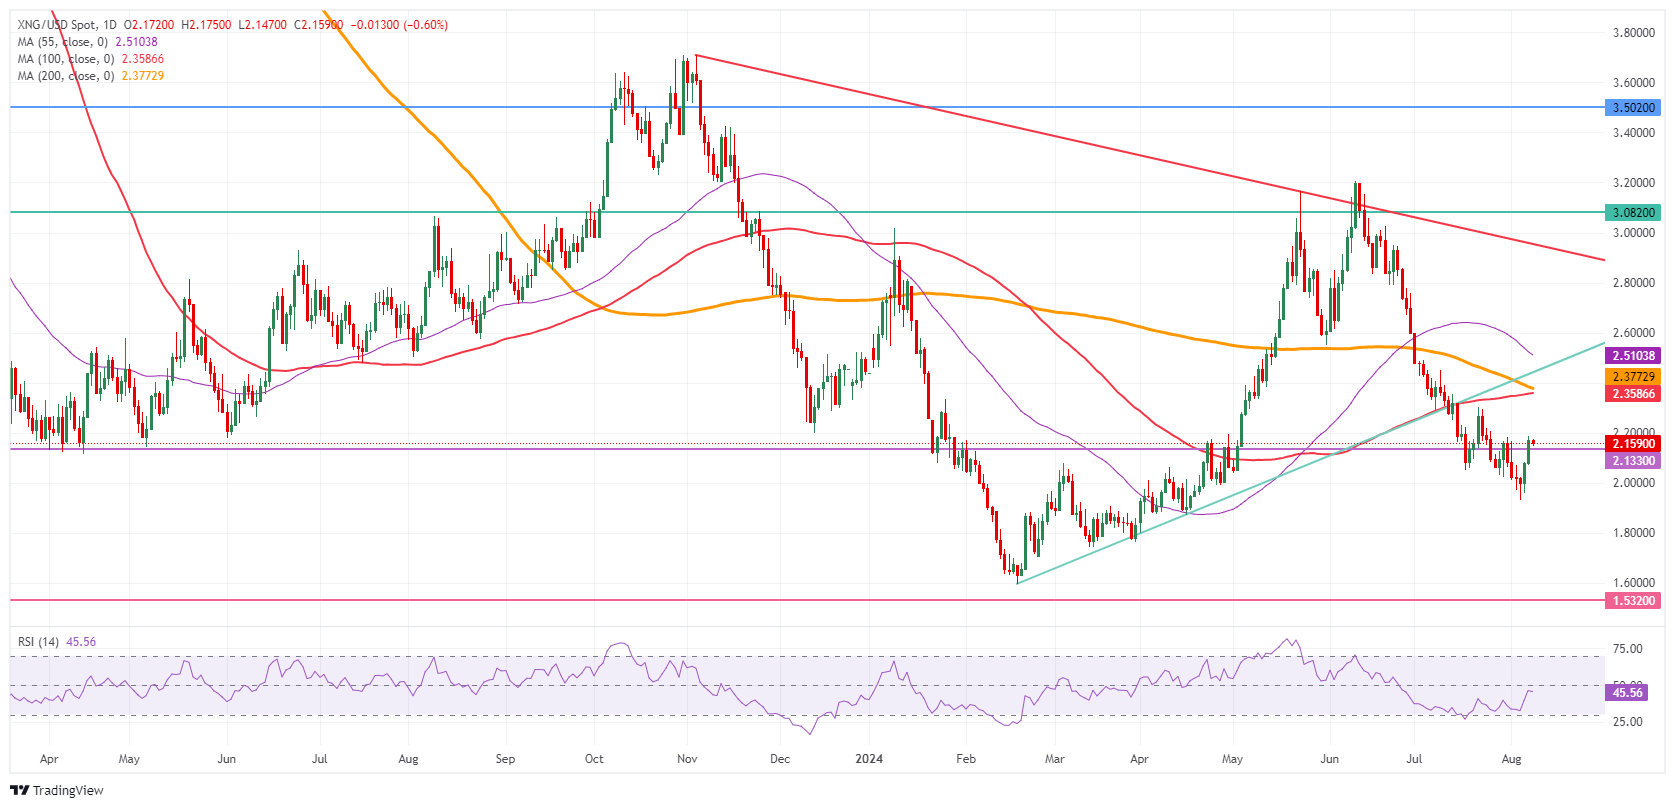
Natural Gas: Daily Chart
Natural Gas FAQs
Supply and demand dynamics are a key factor influencing Natural Gas prices, and are themselves influenced by global economic growth, industrial activity, population growth, production levels, and inventories. The weather impacts Natural Gas prices because more Gas is used during cold winters and hot summers for heating and cooling. Competition from other energy sources impacts prices as consumers may switch to cheaper sources. Geopolitical events are factors as exemplified by the war in Ukraine. Government policies relating to extraction, transportation, and environmental issues also impact prices.
The main economic release influencing Natural Gas prices is the weekly inventory bulletin from the Energy Information Administration (EIA), a US government agency that produces US gas market data. The EIA Gas bulletin usually comes out on Thursday at 14:30 GMT, a day after the EIA publishes its weekly Oil bulletin. Economic data from large consumers of Natural Gas can impact supply and demand, the largest of which include China, Germany and Japan. Natural Gas is primarily priced and traded in US Dollars, thus economic releases impacting the US Dollar are also factors.
The US Dollar is the world’s reserve currency and most commodities, including Natural Gas are priced and traded on international markets in US Dollars. As such, the value of the US Dollar is a factor in the price of Natural Gas, because if the Dollar strengthens it means less Dollars are required to buy the same volume of Gas (the price falls), and vice versa if USD strengthens.
Information on these pages contains forward-looking statements that involve risks and uncertainties. Markets and instruments profiled on this page are for informational purposes only and should not in any way come across as a recommendation to buy or sell in these assets. You should do your own thorough research before making any investment decisions. FXStreet does not in any way guarantee that this information is free from mistakes, errors, or material misstatements. It also does not guarantee that this information is of a timely nature. Investing in Open Markets involves a great deal of risk, including the loss of all or a portion of your investment, as well as emotional distress. All risks, losses and costs associated with investing, including total loss of principal, are your responsibility. The views and opinions expressed in this article are those of the authors and do not necessarily reflect the official policy or position of FXStreet nor its advertisers. The author will not be held responsible for information that is found at the end of links posted on this page.
If not otherwise explicitly mentioned in the body of the article, at the time of writing, the author has no position in any stock mentioned in this article and no business relationship with any company mentioned. The author has not received compensation for writing this article, other than from FXStreet.
FXStreet and the author do not provide personalized recommendations. The author makes no representations as to the accuracy, completeness, or suitability of this information. FXStreet and the author will not be liable for any errors, omissions or any losses, injuries or damages arising from this information and its display or use. Errors and omissions excepted.
The author and FXStreet are not registered investment advisors and nothing in this article is intended to be investment advice.
Recommended content
Editors’ Picks
AUD/USD: The hunt for 0.6800

AUD/USD extended its strong uptrend and reclaimed the area beyond the key 0.6700 barrier to print fresh five-week highs ahead of the release of the RBA Minutes.
EUR/USD clinches 2024 highs and retargets 1.1100
EUR/USD rose to levels last seen in late December 2023 and approached the key 1.1100 hurdle, always on the back of the incessant selling pressure in the US Dollar prior to the FOMC Minutes and Powell’s speech at Jackson Hole.
Gold stable above $2,500 and looking for fresh record highs

The persevering sell-off in the greenback, coupled with lower US yields and hopes of an interest rate cut by the Fed in September, all prompt Gold prices to dispute their record high past the $2,500 mark per ounce troy.
XRP Ledger transactions dropped to nearly a sixth of their value this year

Ripple trades at $0.5833 on Monday as the altcoin extends gains and recovers from the crypto market crash in early August. The Ripple stablecoin announcement, the Securities & Exchange Commission vs. Ripple lawsuit ruling and recent research reports published by SBI-owned HashHub are the key market movers for the altcoin this week.
International economic outlook

We have not made material forecast changes to our economic or inflation outlooks. This month, we continue to forecast 2024 global GDP growth of 2.9% and global CPI inflation of 3.6%. In the United States, we maintain our view for a “soft landing” although acknowledge that recession risks are rising.