- Natural Gas prices show sensitivity towards the situation in the Middle East.
- Markets see sanctions being issued out of US and Europe on Iran.
- The US Dollar Index pops back above 106.00 though faces some selling pressure.
Natural Gas (XNG/USD) prices are getting nervous and torn between two main forces. On one hand the geopolitical risk for a surge in Gas prices is not to be overlooked with the Israel War Cabinet convening at time of writing on which steps Israel will take to retaliate against Iran after the attacks over the weekend. Meanwhile several Federal Reserve officials are confirming rates steady for longer, which could mean a slowdown in demand at hand for the coming months until that first rate cut taking place.
With risks of an escalating war still on the cards, the DXY US Dollar Index is thriving as the main safe haven for investors to park their funds. As if that is not enough, the overall market narrative about US interest rates is changing, with investors pricing in that rates will either stay steady for longer or even rise further even as Federal Reserve (Fed) officials are still seeing a reason to cut this year. The gap between market expectations and the Fed is substantially big, and could mean more US Dollar strength to come should Fed Chairman Jerome Powell this evening admit that cuts will be postponed.
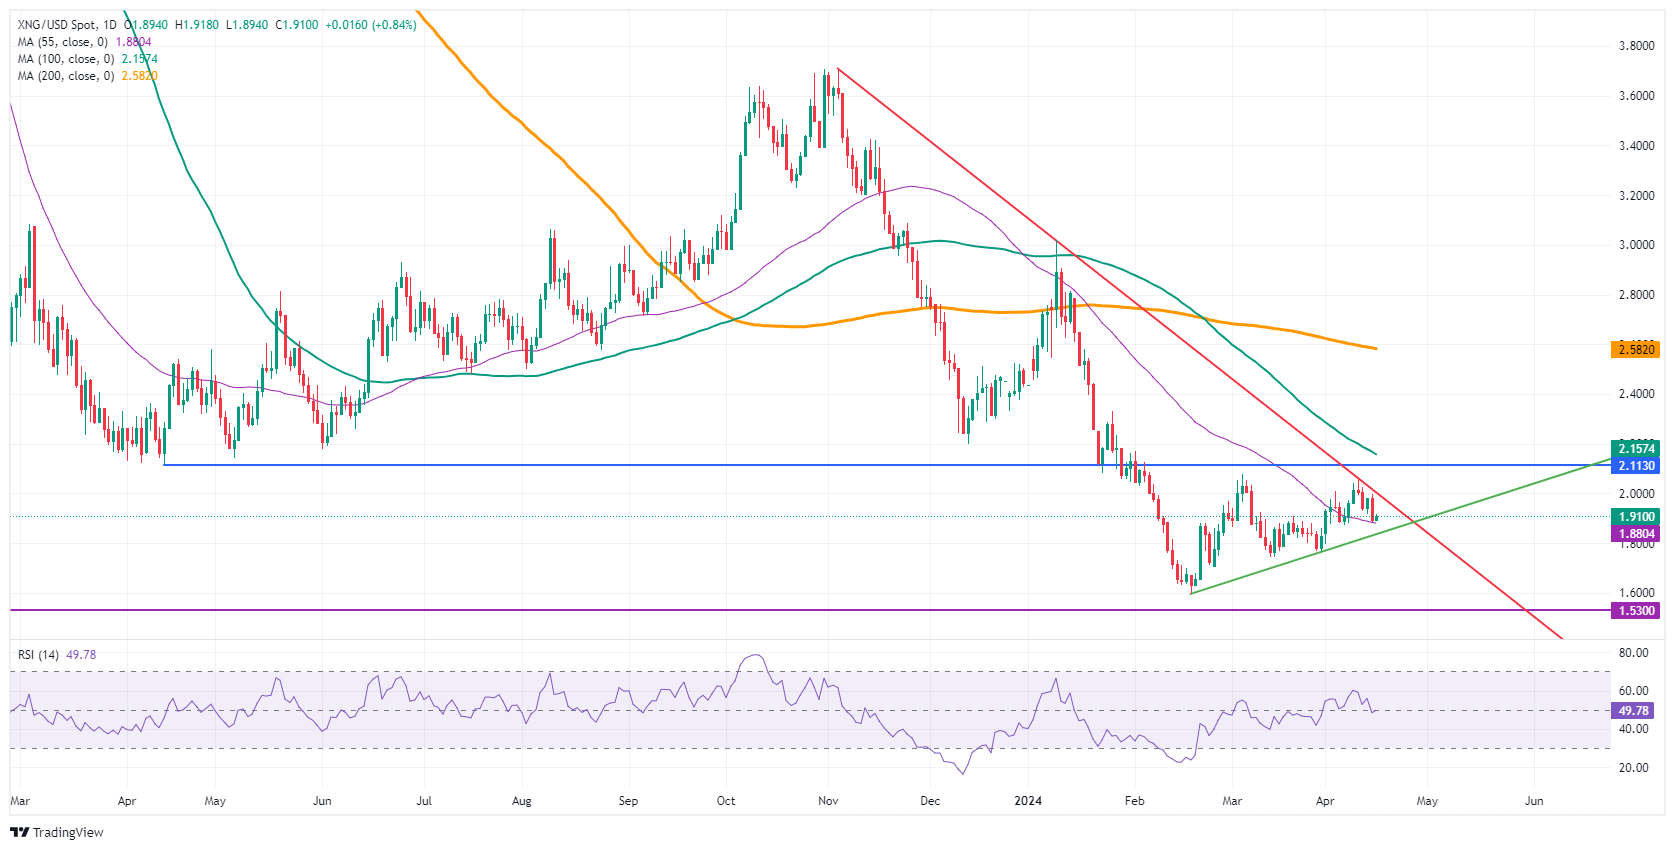
Natural Gas is trading at $1.89 per MMBtu at the time of writing.
Natural Gas news and market movers: Contradictions from EU and US on keeping calm
- US Treasury Secretary Janet Yellen is preparing fresh sanctions on Iran on the back of its unprecedented attacks on Israel over the weekend.
- The Israel War Cabinet is set to meet on Tuesday to discuss responses to Iran, Israeli officials said to Bloomberg.
- Despite several attempts from US Secretary of State Antony Blinken and several G7 heads of state, Israel is planning to advance with another attack on Iran in retaliation for the drone attacks over the weekend, several sources such as Reuters and Bloomberg report.
- European Gas prices are jumping higher as well on the back of Monday’s headline events out of Israel and Iran.
- Unplanned works at Norway’s Nyhamna and Dvalin facilities are expected to take place for the rest of the week, seeing a lower than average Gas flow from Norway into Europe.
- Swiss MET Group has expanded its LNG trading business with long-term capacities in Germany, Spain and Croatia. This further proves the massive international interest in the European Gas market.
Natural Gas Technical Analysis: Israel decision key for direction
Natural Gas prices are at risk of jumping higher with this tit for tat headline risk. Despite several diplomatic calls for Israel to keep its head calm and be the bigger person in the room, Israel said it has all rights to retaliate. This means more tensions will arise in the region, while attention is diverted away from Gaza, and could see supply disruptions in Gas flows with possible key pipelines being sabotaged.
On the upside, the red descending trend line at $1.99-$2.00 looks ready for another test. Should Gas prices snap above it, a quick rally to $2.11 could be seen. Not that far off, $2.15 in the form of the 100-day Simple Moving Average (SMA) becomes the main resistance level.
On the downside, the 55-day SMA around $1.88 should be a safety net. Next, the green ascending trend line near $1.83 should support the rally since mid-February. Should even that level break, a dive to $1.60 and $1.53 would not be impossible.
Natural Gas: Daily Chart
Natural Gas FAQs
Supply and demand dynamics are a key factor influencing Natural Gas prices, and are themselves influenced by global economic growth, industrial activity, population growth, production levels, and inventories. The weather impacts Natural Gas prices because more Gas is used during cold winters and hot summers for heating and cooling. Competition from other energy sources impacts prices as consumers may switch to cheaper sources. Geopolitical events are factors as exemplified by the war in Ukraine. Government policies relating to extraction, transportation, and environmental issues also impact prices.
The main economic release influencing Natural Gas prices is the weekly inventory bulletin from the Energy Information Administration (EIA), a US government agency that produces US gas market data. The EIA Gas bulletin usually comes out on Thursday at 14:30 GMT, a day after the EIA publishes its weekly Oil bulletin. Economic data from large consumers of Natural Gas can impact supply and demand, the largest of which include China, Germany and Japan. Natural Gas is primarily priced and traded in US Dollars, thus economic releases impacting the US Dollar are also factors.
The US Dollar is the world’s reserve currency and most commodities, including Natural Gas are priced and traded on international markets in US Dollars. As such, the value of the US Dollar is a factor in the price of Natural Gas, because if the Dollar strengthens it means less Dollars are required to buy the same volume of Gas (the price falls), and vice versa if USD strengthens.
Information on these pages contains forward-looking statements that involve risks and uncertainties. Markets and instruments profiled on this page are for informational purposes only and should not in any way come across as a recommendation to buy or sell in these assets. You should do your own thorough research before making any investment decisions. FXStreet does not in any way guarantee that this information is free from mistakes, errors, or material misstatements. It also does not guarantee that this information is of a timely nature. Investing in Open Markets involves a great deal of risk, including the loss of all or a portion of your investment, as well as emotional distress. All risks, losses and costs associated with investing, including total loss of principal, are your responsibility. The views and opinions expressed in this article are those of the authors and do not necessarily reflect the official policy or position of FXStreet nor its advertisers. The author will not be held responsible for information that is found at the end of links posted on this page.
If not otherwise explicitly mentioned in the body of the article, at the time of writing, the author has no position in any stock mentioned in this article and no business relationship with any company mentioned. The author has not received compensation for writing this article, other than from FXStreet.
FXStreet and the author do not provide personalized recommendations. The author makes no representations as to the accuracy, completeness, or suitability of this information. FXStreet and the author will not be liable for any errors, omissions or any losses, injuries or damages arising from this information and its display or use. Errors and omissions excepted.
The author and FXStreet are not registered investment advisors and nothing in this article is intended to be investment advice.
Recommended content
Editors’ Picks

AUD/USD trades modestly flat above 0.6400 after Aussie trade data
AUD/USD reacts little to better-than-expected Australian Goods Trade Balance data and remains in a range above 0.6400 early Thursday. Rising bets for an early RBA rate cut cap the Aussie's upside amid China's economic woes and US-Sino trade war fears. Eyes turn to US data, Fedspeak.

USD/JPY fades the dovish BoJ commentary-led uptick above 150.50
USD/JPY is reversing the bounce to near 150.70 in the Asian session on Thursday. The pair remains weighed down by rising bets for another BoJ rate hike this month, shrugging off the dovish comments from BoJ policymaker Nakamura and a modest recovery in the US Treasury bond yields.

Gold price lacks firm near-term direction and is stuck in a familiar range
Gold price extends its sideways consolidative price move in a familiar range, awaiting a fresh catalyst before the next leg of a directional move. Geopolitical tensions, trade war fears and the overnight decline in the US bond yields offer support to the safe-haven XAU/USD.

Ripple's XRP could see a price rebound despite retail activity decline, RLUSD launch delay
XRP traded near $2.4 on Wednesday as Ripple Labs clarified that its RLUSD stablecoin will not debut on exchanges despite a rumored launch among crypto community members. Amid a sharp decline in XRP's price, on-chain data shows the remittance-based token still has the potential to resume its rally.

Four out of G10
In most cases, the G10 central bank stories for December are starting to converge on a single outcome. Here is the state of play: Fed: My interpretation of Waller’s speech this week is that his prior probability for a December cut was around 75% before the data.

Best Forex Brokers with Low Spreads
VERIFIED Low spreads are crucial for reducing trading costs. Explore top Forex brokers offering competitive spreads and high leverage. Compare options for EUR/USD, GBP/USD, USD/JPY, and Gold.
