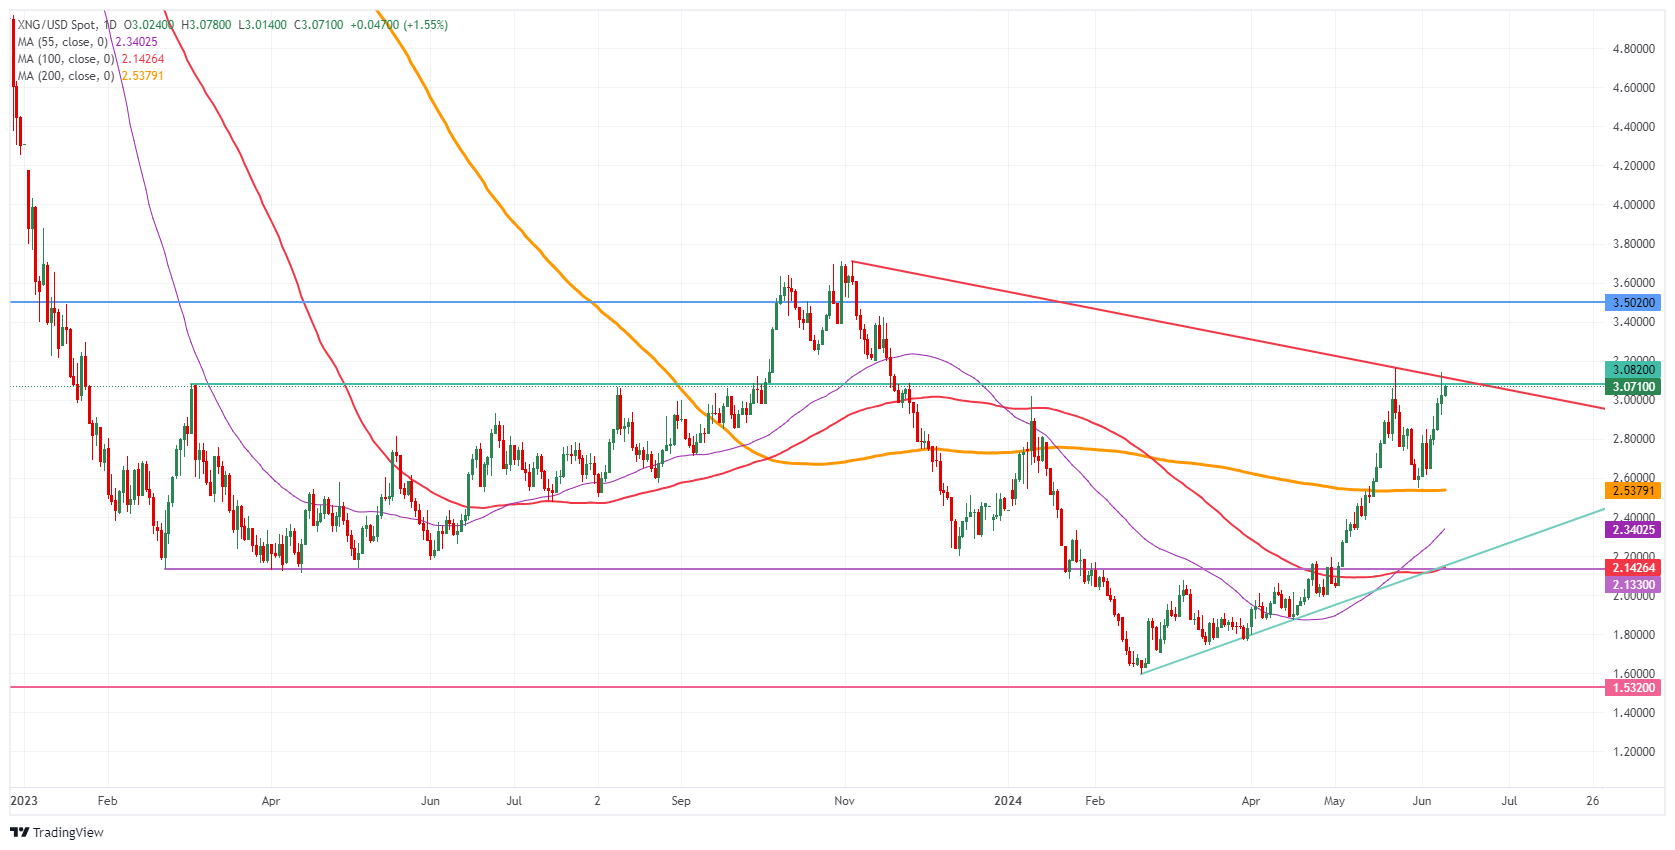
- Natural Gas price shows no signs of fatigue and resides near the high of 2024.
- Chevron's Wheatstone LNG plant ountage causes supply tightening.
- The US Dollar Index resides near 105.00 ahead of Wednesday’s CPI and Fed meeting.
Natural Gas price (XNG/USD) is sprinting higher with traders betting on a breakdown on gas supply for Europe, as Europe discusses ways of keeping flows via Ukraine alive next year and amid increasing supply from Norway. While Norwegian flows are at their highest levels since April, Europe is looking to talk to Ukraine and Russia to keep the Gas flowing. This opens up a sore wound for Europe after it pledged to ban Russian gas. With big uncertainties now over whether Europe can even become independent from Russian Gas, prices are rallying as traders foresee that Europe will need to buy more Gas if Russia or Ukraine refuse to strike a deal.
Meanwhile, the US Dollar Index (DXY), which tracks the Greenback’s value against six major currencies, is lingering above 105.00 in a very calm start of the week. The DXY was moving a bit on Monday on the back of the outcome from the European elections, though the move has eased now. It looks like traders will await the main events on Wednesday, with the Consumer Price Index (CPI) release and the US Federal Reserve’s (Fed) rate decision and dot plot.
Natural Gas is trading at $3.08 per MMBtu at the time of writing.
Natural Gas news and market movers: Europe caught by Russia and supply
- Bloomberg reports that Chevron has halted all gas production at its Wheatstone offshore facility in Australia to complete repairs to the fuel system. Production was already suspended on Monday.
- Ukraine’s state-run Gas company Naftogaz says it sees substantial interest from Europe to tap its Gas reserves and facilities, Reuters reports.
- Europe is considering bypassing Ukraine should Kyiv not want to cooperate with a European-Russian Gas deal. One option under consideration is to divert gas flows from Ukraine to Azerbaijan into Europe, Bloomberg reports.
Natural Gas Technical Analysis: Europe faces headwinds
Natural Gas trades higher, printing a fifth green daily candle in a row. Though more upside might be granted, the current level is a heavy cap which will not be easy to overcome. Should this $3.07-$3.10 barrier snap, a quick run up to $3.50 could be in the cards.
The pivotal level near $3.07 (high from March 6, 2023) remains key as prices failed to post a daily close above it. Add the red descending trend line coming in at $3.12, which would slam down any attempts to jump higher. Further up, the fresh year-to-date high at $3.16 is the level to beat.
On the downside, the 200-day Simple Moving Average (SMA) acts as the first support near $2.53. Should that support area fail to hold, the next target could be the pivotal level near $2.14, with interim support by the 55-day SMA near $2.34. Further down, the biggest support comes at $2.11 with the 100-day SMA.
Natural Gas: Daily Chart
Natural Gas FAQs
Supply and demand dynamics are a key factor influencing Natural Gas prices, and are themselves influenced by global economic growth, industrial activity, population growth, production levels, and inventories. The weather impacts Natural Gas prices because more Gas is used during cold winters and hot summers for heating and cooling. Competition from other energy sources impacts prices as consumers may switch to cheaper sources. Geopolitical events are factors as exemplified by the war in Ukraine. Government policies relating to extraction, transportation, and environmental issues also impact prices.
The main economic release influencing Natural Gas prices is the weekly inventory bulletin from the Energy Information Administration (EIA), a US government agency that produces US gas market data. The EIA Gas bulletin usually comes out on Thursday at 14:30 GMT, a day after the EIA publishes its weekly Oil bulletin. Economic data from large consumers of Natural Gas can impact supply and demand, the largest of which include China, Germany and Japan. Natural Gas is primarily priced and traded in US Dollars, thus economic releases impacting the US Dollar are also factors.
The US Dollar is the world’s reserve currency and most commodities, including Natural Gas are priced and traded on international markets in US Dollars. As such, the value of the US Dollar is a factor in the price of Natural Gas, because if the Dollar strengthens it means less Dollars are required to buy the same volume of Gas (the price falls), and vice versa if USD strengthens.
Information on these pages contains forward-looking statements that involve risks and uncertainties. Markets and instruments profiled on this page are for informational purposes only and should not in any way come across as a recommendation to buy or sell in these assets. You should do your own thorough research before making any investment decisions. FXStreet does not in any way guarantee that this information is free from mistakes, errors, or material misstatements. It also does not guarantee that this information is of a timely nature. Investing in Open Markets involves a great deal of risk, including the loss of all or a portion of your investment, as well as emotional distress. All risks, losses and costs associated with investing, including total loss of principal, are your responsibility. The views and opinions expressed in this article are those of the authors and do not necessarily reflect the official policy or position of FXStreet nor its advertisers. The author will not be held responsible for information that is found at the end of links posted on this page.
If not otherwise explicitly mentioned in the body of the article, at the time of writing, the author has no position in any stock mentioned in this article and no business relationship with any company mentioned. The author has not received compensation for writing this article, other than from FXStreet.
FXStreet and the author do not provide personalized recommendations. The author makes no representations as to the accuracy, completeness, or suitability of this information. FXStreet and the author will not be liable for any errors, omissions or any losses, injuries or damages arising from this information and its display or use. Errors and omissions excepted.
The author and FXStreet are not registered investment advisors and nothing in this article is intended to be investment advice.
Recommended content
Editors’ Picks
EUR/USD extends recovery beyond 1.0400 amid Wall Street's turnaround
EUR/USD extends its recovery beyond 1.0400, helped by the better performance of Wall Street and softer-than-anticipated United States PCE inflation. Profit-taking ahead of the winter holidays also takes its toll.
GBP/USD nears 1.2600 on renewed USD weakness
GBP/USD extends its rebound from multi-month lows and approaches 1.2600. The US Dollar stays on the back foot after softer-than-expected PCE inflation data, helping the pair edge higher. Nevertheless, GBP/USD remains on track to end the week in negative territory.

Gold rises above $2,620 as US yields edge lower
Gold extends its daily rebound and trades above $2,620 on Friday. The benchmark 10-year US Treasury bond yield declines toward 4.5% following the PCE inflation data for November, helping XAU/USD stretch higher in the American session.
Bitcoin crashes to $96,000, altcoins bleed: Top trades for sidelined buyers
Bitcoin (BTC) slipped under the $100,000 milestone and touched the $96,000 level briefly on Friday, a sharp decline that has also hit hard prices of other altcoins and particularly meme coins.
Bank of England stays on hold, but a dovish front is building
Bank of England rates were maintained at 4.75% today, in line with expectations. However, the 6-3 vote split sent a moderately dovish signal to markets, prompting some dovish repricing and a weaker pound. We remain more dovish than market pricing for 2025.

Best Forex Brokers with Low Spreads
VERIFIED Low spreads are crucial for reducing trading costs. Explore top Forex brokers offering competitive spreads and high leverage. Compare options for EUR/USD, GBP/USD, USD/JPY, and Gold.
