- Natural Gas price edges lower on Thursday, albeit lacks follow-through selling.
- The technical setup favours bulls and supports prospects for additional gains.
- A break below the overnight swing low is needed to negate the positive outlook.
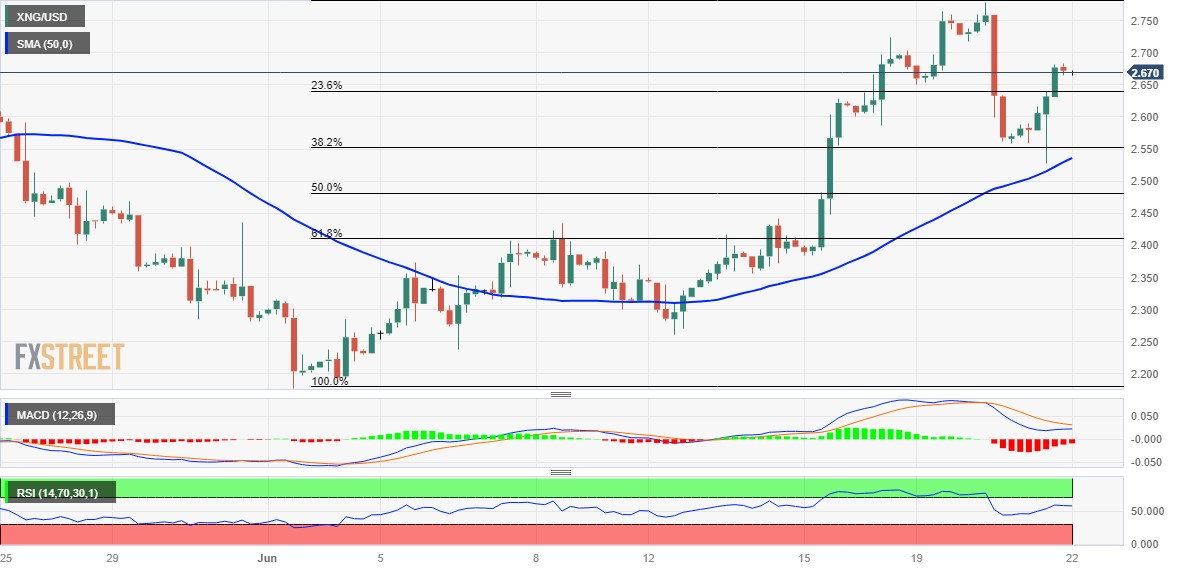
Natural Gas price struggles to capitalize on the previous day's solid bounce from the weekly low and meets with some supply during the Asian session on Thursday. The XNG/USD currently trades around the $2.670 area, down over 0.10% for the day, though the technical setup favours bullish traders.
This week's pullback from a one-month high touched on Tuesday showed some resilience below the 38.2% Fibonacci retracement level of the rally witnessed since the beginning of this month. The subsequent rally back above the 23.6% Fibo. level adds credence to the positive outlook and supports prospects for a further near-term appreciating move. Hence, any subsequent slide might still be seen as a buying opportunity and is likely to remain limited.
The 23.6% Fibo. level, around the $2.65 region now seems to protect the immediate downside ahead of the $2.55 area, or the 38.2% Fibo. level. This is followed by the overnight low, just above the mid-$2.00s horizontal resistance breakpoint, which coincides with the 50-period Simple Moving Average (SMA) on the 4-hour chart and should act as a pivotal point. A convincing break below might prompt some technical selling and pave the way for deeper losses.
The XNG/USD might then accelerate the fall towards 61.8% Fibo. level, around the $2.40 region before eventually dropping to the $2.285-$2.275 area. The downward trajectory could get extended and expose the monthly low, around the $2.195-2.175 zone.
On the flip side, immediate resistance is pegged near the $2.755-$2.765 area ahead of the monthly top, around the $2.780 region. Some follow-through buying will be seen as a fresh trigger for bullish traders and lift the XNG/USD beyond an intermediate barrier near $2.915, towards reclaiming the $3.000 round figure. The momentum could get extended further and eventually lift Natural Gas price to the March swing high, around the $3.075-$3.080 zone.
XNG/USD 4-hour chart
Information on these pages contains forward-looking statements that involve risks and uncertainties. Markets and instruments profiled on this page are for informational purposes only and should not in any way come across as a recommendation to buy or sell in these assets. You should do your own thorough research before making any investment decisions. FXStreet does not in any way guarantee that this information is free from mistakes, errors, or material misstatements. It also does not guarantee that this information is of a timely nature. Investing in Open Markets involves a great deal of risk, including the loss of all or a portion of your investment, as well as emotional distress. All risks, losses and costs associated with investing, including total loss of principal, are your responsibility. The views and opinions expressed in this article are those of the authors and do not necessarily reflect the official policy or position of FXStreet nor its advertisers. The author will not be held responsible for information that is found at the end of links posted on this page.
If not otherwise explicitly mentioned in the body of the article, at the time of writing, the author has no position in any stock mentioned in this article and no business relationship with any company mentioned. The author has not received compensation for writing this article, other than from FXStreet.
FXStreet and the author do not provide personalized recommendations. The author makes no representations as to the accuracy, completeness, or suitability of this information. FXStreet and the author will not be liable for any errors, omissions or any losses, injuries or damages arising from this information and its display or use. Errors and omissions excepted.
The author and FXStreet are not registered investment advisors and nothing in this article is intended to be investment advice.
Recommended content
Editors’ Picks
EUR/USD stays in positive territory above 1.0850 after US data

EUR/USD clings to modest daily gains above 1.0850 in the second half of the day on Friday. The improving risk mood makes it difficult for the US Dollar to hold its ground after PCE inflation data, helping the pair edge higher ahead of the weekend.
GBP/USD stabilizes above 1.2850 as risk mood improves

GBP/USD maintains recovery momentum and fluctuates above 1.2850 in the American session on Friday. The positive shift seen in risk mood doesn't allow the US Dollar to preserve its strength and supports the pair.
Gold rebounds above $2,380 as US yields stretch lower

Following a quiet European session, Gold gathers bullish momentum and trades decisively higher on the day above $2,380. The benchmark 10-year US Treasury bond yield loses more than 1% on the day after US PCE inflation data, fuelling XAU/USD's upside.
Avalanche price sets for a rally following retest of key support level

Avalanche (AVAX) price bounced off the $26.34 support level to trade at $27.95 as of Friday. Growing on-chain development activity indicates a potential bullish move in the coming days.
The election, Trump's Dollar policy, and the future of the Yen

After an assassination attempt on former President Donald Trump and drop out of President Biden, Kamala Harris has been endorsed as the Democratic candidate to compete against Trump in the upcoming November US presidential election.