|

Natural Gas Price Analysis: XNG/USD eases from 200-SMA within symmetrical triangle as Fed decision looms

  • Natural Gas Price takes offers to refresh intraday low, prints the first daily loss in three.
  • Failure to cross the key moving average joins RSI retreat, sluggish MACD to tease sellers.
  • Two-week-old symmetrical triangle challenges XNG/USD bears beyond $2.27; bulls need validation from $2.42.

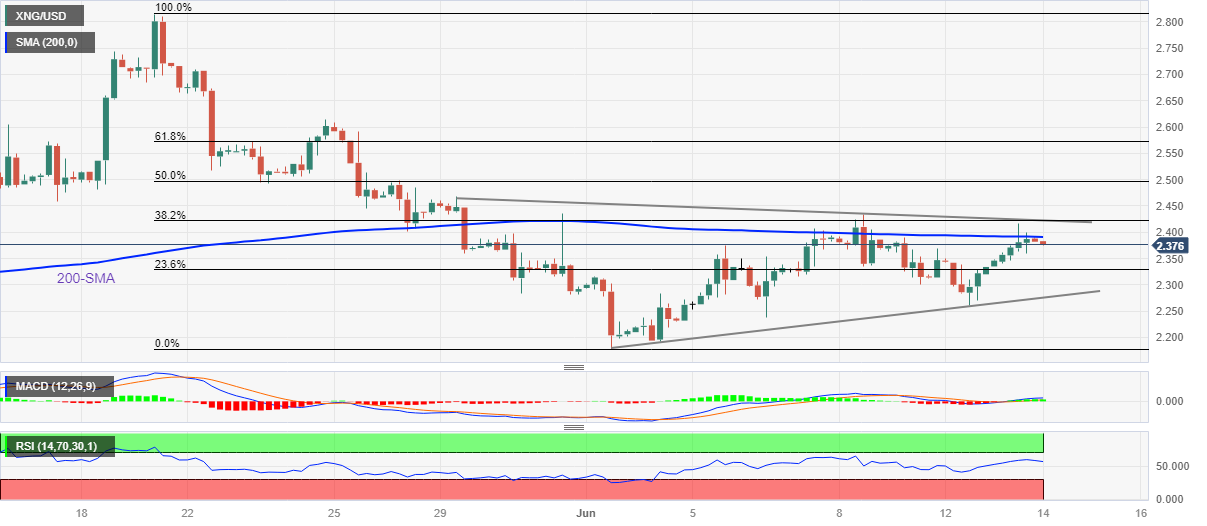
Natural Gas Price (XNG/USD) remains on the back foot around $2.37 as it snaps a two-day winning streak during early Wednesday. In doing so, the XNG/USD portrays the typical market consolidation ahead of the Federal Reserve’s (Fed) monetary policy announcements.

That said, the Natural Gas Price recently reversed from the 200-SMA while staying within a 12-day-long symmetrical triangle formation.

Apart from the chart pattern suggesting sideways of the energy instrument, the sluggish MACD signals and the RSI (14) line’s retreat from the above-50.0 area also challenge the XNG/USD traders.

However, the commodity’s U-turn from the key moving average suggests an intraday decline in the price. The same highlights the 23.6% Fibonacci retracement of the XNG/USD’s fall from May 19 to June 01, close to $2.33 at the latest.

Following that, the stated triangle’s bottom line of around $2.27 will be in the spotlight as a break of which could quickly drag the Natural Gas Price towards refreshing the yearly low, currently around $2.11. It should be noted that May’s bottom of near $2.17 can act as an intermediate halt during the anticipated fall.

Alternatively, XNG/USD recovery needs validation from the 200-SMA hurdle of around $2.39, closely followed by the $2.40 round figure.

Also acting as the short-term key upside barrier for the Natural Gas price is the stated triangle’s upper line, close to $2.42 at the latest, a break of which can refresh the monthly high of around $2.43 by approaching the 50.0% and 61.8% Fibonacci retracements levels, near $2.50 and $2.57 in that order.

Natural Gas Price: Four-hour chart

Trend: Limited downside expected

Author

Anil Panchal

Anil Panchal

FXStreet

Anil Panchal has nearly 15 years of experience in tracking financial markets. With a keen interest in macroeconomics, Anil aptly tracks global news/updates and stays well-informed about the global financial moves and their implications.

More from Anil Panchal
Share:

Markets move fast. We move first.

Orange Juice Newsletter brings you expert driven insights - not headlines. Every day on your inbox.

By subscribing you agree to our Terms and conditions.

Editor's Picks

EUR/USD climbs toward 1.1800 on broad USD weakness

EUR/USD gathers bullish momentum and advances toward 1.1800 in the second half of the day on Tuesday. The US Dollar weakens and helps the pair stretch higher after the employment report showed that Nonfarm Payrolls declined by 105,000 in October before rising by 64,000 in November.

GBP/USD climbs to fresh two-month high above 1.3400

GBP/USD gains traction in the American session and trades at its highest level since mid-October above 1.3430. The British Pound benefits from upbeat PMI data, while the US Dollar struggles to find demand following the mixed employment figures and weaker-than-forecast PMI prints, allowing the pair to march north.

Gold extends its consolidative phase around $4,300

Gold trades in positive above $4,300 after spending the first half of the day under bearish pressure. XAU/USD capitalizes on renewed USD weakness after the jobs report showed that the Unemployment Rate climbed to 4.6% in November and the PMI data revealed a loss of growth momentum in the private sector in December. 

US Retail Sales virtually unchanged at $732.6 billion in October

Retail Sales in the United States were virtually unchanged at $732.6 billion in October, the US Census Bureau reported on Tuesday. This print followed the 0.1% increase (revised from 0.3%) recorded in September and came in below the market expectation of +0.1%.

Ukraine-Russia in the spotlight once again

Since the start of the week, gold’s price has moved lower, but has yet to erase the gains made last week. In today’s report we intend to focus on the newest round of peace talks between Russia and Ukraine, whilst noting the release of the US Employment data later on day and end our report with an update in regards to the tensions brewing in Venezuela.

BNB Price Forecast: BNB slips below $855 as bearish on-chain signals and momentum indicators turn negative

BNB, formerly known as Binance Coin, continues to trade down around $855 at the time of writing on Tuesday, after a slight decline the previous day. Bearish sentiment further strengthens as BNB’s on-chain and derivatives data show rising retail activity.