|

Natural Gas Price Analysis: XNG/USD bulls attack $2.75 hurdle as full markets return

  • Natural Gas picks up bids to defend the previous day’s recovery, mildly bid of late.
  • 200-HMA, top line of a fortnight-old symmetrical triangle restricts XNG/USD upside.
  • Bullish MACD signals, upbeat RSI keeps Natural Gas buyers hopeful.
  • Downside break of $2.66 can recall XNG/USD bears.

Natural Gas (XNG/USD) Price remains on the front foot around $2.75 amid early Wednesday, extending the previous day’s run-up during a sluggish Asian session.

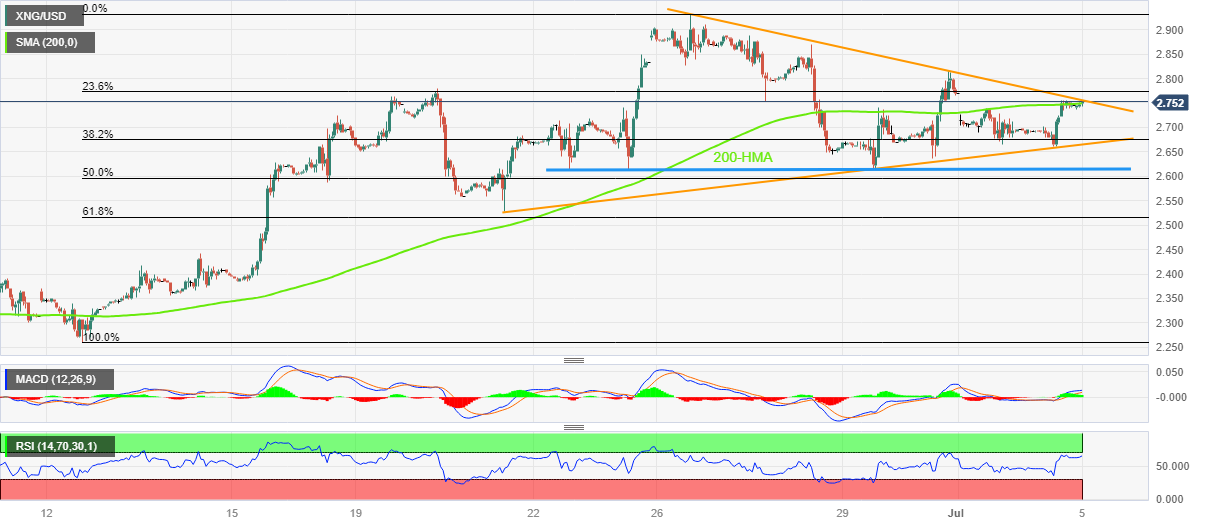
In doing so, the Natural Gas Price jostles with a convergence of the 200-Hour Moving Average (HMA) and the top line of a two-week-long symmetrical triangle, close to $2.75 at the latest.

That said, the bullish MACD signals and the upbeat RSI (14) line, not overbought, suggest further upside of the XNG/USD price past the $2.75 hurdle.

In that case, Friday’s peak of near $2.82 may act as an intermediate check for the Natural Gas run-up targeting the previous monthly high of around $2.93.

It’s worth noting that further advances of the Natural Gas price past $2.93 appear elusive as the $3.00 round figure and March’s peak of $3.08 will be tough nuts to crack for the XNG/USD bulls afterward.

Meanwhile, pullback moves remain elusive unless staying within the aforementioned triangle, currently between $2.75 and $2.66.

Also acting as the downside filter for the Natural Gas Price is the horizontal support around $2.60, a break of which will welcome the XNG/USD bears.

Natural Gas Price: Hourly chart

Trend: Further upside expected

Author

Anil Panchal

Anil Panchal

FXStreet

Anil Panchal has nearly 15 years of experience in tracking financial markets. With a keen interest in macroeconomics, Anil aptly tracks global news/updates and stays well-informed about the global financial moves and their implications.

More from Anil Panchal
Share:

Editor's Picks

EUR/USD appears supported by the 200-day SMA, for now

Following an early pullback to multi-week lows near 1.1670, EUR/USD now manages to reclaim the 1.1700 region as the NA session draws to a close on Monday. The steep retracement in spot follows the equally strong move higher in the US Dollar, as investors continue to assess the geopolitical landscape in the wake of the US and Israel attacks on Iran.


GBP/USD hits new yearly lows near 1.3300

GBP/USD adds to the recent bearish tone, approaching to the key 1.3300 support to reach fresh YTD troughs against the backdrop of the robust performance of the US Dollar. Indeed, Cable’s decline comes amid the firm demand for the safe-haven space in the wake of the US and Israel attacks to Iran.

Gold eases some ground, approaches $5,300

Gold now surrenders part of the earlier advance, reshifting its attenton to the $5,300 zone per troy ounce at the beginning of the week. Indeed, the yellow metal’s firm performance appears propped up by incresing geopolitical jitters in the Middle East, which at the same time fuels the demand for the safe-haven space.

Strategy lifts holdings to 3.4% of Bitcoin's total supply amid inflows into crypto products

Strategy continued its accumulation of the top crypto last week, acquiring 3,015 BTC for $204 million amid renewed interest in crypto products after four weeks of outflows.

The Fed is finally talking about AI – Here's why it matters for the US Dollar

AI is moving from earnings calls into the heart of monetary policy discussions, forcing Federal Reserve officials to confront a new question: How to act if AI reshapes inflation, employment and interest rates at the same time?

Grass 20% bullish breakout defies broader market weakness

Grass (GRASS) is edging up above $0.30 at the time of writing on Monday. The token’s notable 20% intraday surge stands out amid heightened volatility in the broader crypto market.