- Natural Gas snaps two-day downtrend but struggles to extend corrective bounce.
- Convergence of 21-EMA, three-week-old descending resistance line prods buyers.
- Multiple supports from late February restrict immediate downside.
- Sluggish oscillators suggest a continuation of downward grind.
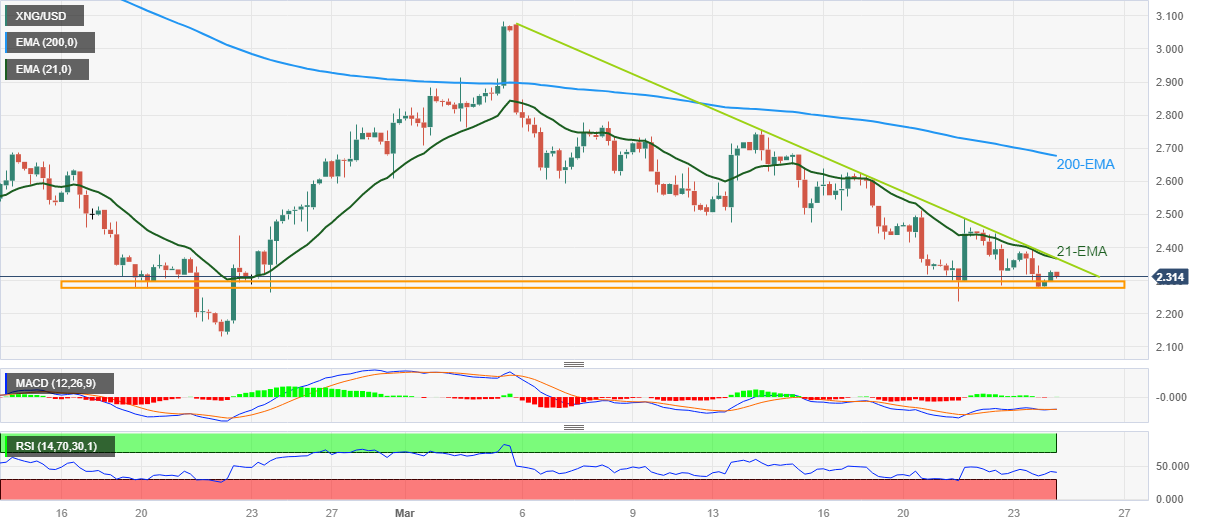
Natural Gas Price (XNG/USD) portrays a corrective bounce from the short-term key support while snapping a two-day losing streak around $2.31 heading into Friday’s European session. In doing so, the energy benchmark bounces off a five-wee-long horizontal support area. Even so, XNG/USD remains pressured for the third consecutive week.
It’s worth observing that Natural Gas’s latest rebound lacks support from the MACD and RSI as both the oscillators portray a lack of momentum, which in turn increases the odds of the commodity’s further weakness.
However, a clear downside break of the $2.30-28 support area, encompassing multiple levels marked since February 19, restricts the short-term downside of the Natural Gas price.
Should the quote breaks the $2.28 support, the odds of witnessing a slump toward the monthly low of $2.13, also the lowest level since August 2020, can’t be ruled out.
In a case where the XNG/USD remains bearish past $2.13, the $2.00 will be crucial to watch as a break which could make the quite vulnerable to testing the mid-2020 lows surrounding $1.53.
On the flip side, a convergence of the 21-bar Exponential Moving Average (EMA) joins a downward-sloping trend line from March 05, to highlight $2.37 as the short-term key upside hurdle.
Also acting as important resistance for the Natural Gas price is $2.50 and the 200-EMA level surrounding $2.68.
Overall, Natural Gas price remains bearish but short-term grinding can’t be ruled out.
Natural Gas: Four-hour chart
Trend: Further downside expected
Information on these pages contains forward-looking statements that involve risks and uncertainties. Markets and instruments profiled on this page are for informational purposes only and should not in any way come across as a recommendation to buy or sell in these assets. You should do your own thorough research before making any investment decisions. FXStreet does not in any way guarantee that this information is free from mistakes, errors, or material misstatements. It also does not guarantee that this information is of a timely nature. Investing in Open Markets involves a great deal of risk, including the loss of all or a portion of your investment, as well as emotional distress. All risks, losses and costs associated with investing, including total loss of principal, are your responsibility. The views and opinions expressed in this article are those of the authors and do not necessarily reflect the official policy or position of FXStreet nor its advertisers. The author will not be held responsible for information that is found at the end of links posted on this page.
If not otherwise explicitly mentioned in the body of the article, at the time of writing, the author has no position in any stock mentioned in this article and no business relationship with any company mentioned. The author has not received compensation for writing this article, other than from FXStreet.
FXStreet and the author do not provide personalized recommendations. The author makes no representations as to the accuracy, completeness, or suitability of this information. FXStreet and the author will not be liable for any errors, omissions or any losses, injuries or damages arising from this information and its display or use. Errors and omissions excepted.
The author and FXStreet are not registered investment advisors and nothing in this article is intended to be investment advice.
Recommended content
Editors’ Picks

EUR/USD struggles to hold above 1.1000 after mixed EU data
EUR/USD is having a difficult time stabilizing above 1.1000 in the European session on Monday. The Eurozone Sentix Investor Confidence slumped to -19.5 in April while the annual February Retail Sales jumped 2.3%, limiting the pair's upside despite the broad US Dollar weakness.

GBP/USD reverses below 1.2900 despite US Dollar weakness
GBP/USD fails to sustain the recovery and reverses below 1.2900 in European trading on Monday. The pair shrugs off broad US Dollar weakness as risk sentiment takes a fresh hit, with European traders hitting their desks, weighing on the risk sensitive Pound Sterling.

Gold price holds above $3,000 amid a global meltdown; bulls seem non-committed
Gold price attracts some sellers near the $3,055 support-turned-resistance and stalls its intraday recovery from the $2,972-2,971 area, or a nearly four-week low touched earlier this Monday. Investors continue to unwind their bullish positions to cover losses from a broader meltdown across the global financial markets

Crypto market wipes out $1 billion in liquidation as Asian markets bleed red
The crypto markets continue to decline on Monday, with Bitcoin falling below $78,000. The Asian markets also traded in the red, with Japan’s stock market extending losses to 8.5%, its lowest level since October 2023.

Strategic implications of “Liberation Day”
Liberation Day in the United States came with extremely protectionist and inward-looking tariff policy aimed at just about all U.S. trading partners. In this report, we outline some of the more strategic implications of Liberation Day and developments we will be paying close attention to going forward.

The Best brokers to trade EUR/USD
SPONSORED Discover the top brokers for trading EUR/USD in 2025. Our list features brokers with competitive spreads, fast execution, and powerful platforms. Whether you're a beginner or an expert, find the right partner to navigate the dynamic Forex market.