|

Natural Gas Price Analysis: Reverses from support-turned-resistance towards $2.66

  • Natural Gas Price prints the first daily loss in three while reversing from three-week-old previous support.
  • Looming bear cross on MACD, descending RSI line add strength to downside bias targeting 21-EMA.
  • 61.8% Fibonacci retracement checks XNG/USD bears; 1.5-month-old ascending resistance line appears key hurdle for Natural Gas buyers.

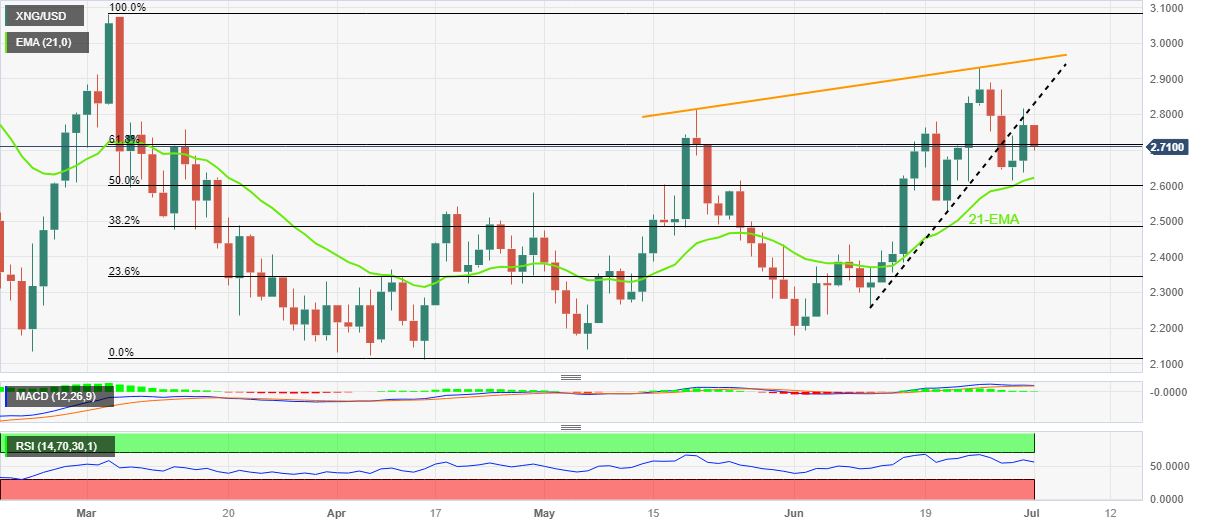
Natural Gas Price (XNG/USD) drops more than 2.0% to $2.71 early Monday as it snaps the previous day's two-day run-up while reversing from a six-week-old support-turned-resistance line.

Not only the XNG/USD’s U-turn from the previous support line but the impending bear cross on the MACD and downward-sloping RSI (14) line from the overbought territory add strength to the bearish bias about the Natural Gas Price.

However, the 21-Exonential Moving Average (EMA) level of $2.66 put a floor under the short-term XNG/USD price.

It’s worth noting that the 61.8% Fibonacci retracement of its March-April fall, near $2.71, limits the immediate downside of the Natural Gas Price whereas the 50% Fibonacci retracement level can act as additional support for the energy instrument near $2.60.

In a case where the XNG/USD remains bearish past $2.60, April’s peak of $2.58 will act as the last defense of the Natural Gas sellers.

On the contrary, a run-up beyond the previous support line, around $2.83 by the press time, isn’t an open invitation to the Natural Gas buyers as an upward-sloping resistance line from May 19, close to $2.95, will challenge the upside momentum before directing the price to March’s peak of near $3.08.

Also acting as an upside filter is the $3.00 psychological magnet.

Overall, the Natural Gas Price is likely to witness further downside but the room towards the south appears limited.

Natural Gas Price: Daily chart

Trend: Further weakness expected

Author

Anil Panchal

Anil Panchal

FXStreet

Anil Panchal has nearly 15 years of experience in tracking financial markets. With a keen interest in macroeconomics, Anil aptly tracks global news/updates and stays well-informed about the global financial moves and their implications.

More from Anil Panchal
Share:

Editor's Picks

EUR/USD rises to 1.1800 neighborhood amid renewed USD selling and trade uncertainties

The EUR/USD pair regains positive traction during the Asian session on Wednesday and jumps to the 1.1800 neighborhood in the last hour, reversing the previous day's modest losses. The intraday move up is sponsored by the emergence of fresh US Dollar, which continues to be weighed down by persistent trade-related uncertainties.

GBP/USD remains stronger above 1.3500 following Trump’s State of the Union

GBP/USD remains in the positive territory for the fourth successive session, trading around 1.3510 during the Asian hours on Wednesday. The pair appreciates as the US Dollar remains subdued following US President Donald Trump’s first State of the Union address of his second administration before a joint session of Congress.

Gold stays firm above $5,150 as Trump's delivers State of the Union speech

Gold finds fresh demand and regains the $5,150 level following the previous day's pullback from the monthly peak as traders assess Trump's State of the Union address. Trade-related uncertainties and geopolitical risks seem to act as a tailwind for the safe-haven bullion. 

Bitcoin, Ethereum and Ripple post cautious recovery amid downside risks

Bitcoin, Ethereum, and Ripple are posting a cautious recovery on Wednesday following a market correction earlier this week.  BTC is approaching a key breakdown level, while ETH and XRP are rebounding from crucial support levels.

The Citrini report: How a debatable AI narrative can shake Wall Street

That AI-related headline alone was enough to rattle investors.US stocks slid sharply on Monday after a widely circulated Citrini Research memo outlined a hypothetical “2028 Global Intelligence Crisis”, warning that rapid AI adoption could push US unemployment into double digits as early as by mid-2028.

XRP pressured by weak ETF flows and declining retail interest

Ripple (XRP) is edging lower, trading above its intraday low of $1.32 at the time of writing on Tuesday. The decline from its weekly opening of $1.39 reflects heightened volatility in the broader cryptocurrency market, accentuated by tariff-triggered uncertainty.