- Natural Gas adds another to its correction, hitting six-week low.
- A Louisiana judge has lifted Biden’s ban on new licenses for LNG exports.
- The US Dollar index rallies higher and pops above 106.00 on concerns about a Trump win.
Natural Gas price (XNG/USD) is close to locking in a sixth day in a row of losses, making the correction even more painful. Over 15% in value has already evaporated since June 25th, and more downturns could be at hand as a US judge in Louisiana issued a ruling on Monday to lift the current ban on new export licenses for Liquified Natural Gas (LNG). The Biden administration had issued a ban for new LNG export licenses a few months ago, in order to meet demands from climate changes and reforms.
Meanwhile, the US Dollar Index (DXY), which tracks the Greenback’s value against six major currencies, is having a field day and rallies higher on concerns in the bond markets. With former US President Donald Trump in the lead now in recent polls, his spending plan is a concern for the bond market. With ample amounts of spending, the US debt would become intolerable, while other measures, such as tariffs, are hardly enough to offset any big spending promises.
Natural Gas is trading at $2.45 per MMBtu at the time of writing.
Natural Gas news and market movers: More downside ahead
- US District Judge James D. Cain Jr. in Louisiana has decided in favor of 16 states that opposed US President Joe Biden’s current export moratorium on new LNG projects, Bloomberg reports.
- Bloomberg’s Energy Desk is forecasting that any supply glut in LNG will be absorbed by 2030 as several new projects currently are facing substantial delays, which means not being operative by the time already operational plants are set to near the end of their lifetime cycle.
- European Gas prices are facing less downturn, with several regions experiencing substantially elevated temperatures, and sparking demand for electricity in order to keep air conditioners performing, Reuters reports.
Natural Gas Technical Analysis: Support not near at all
Natural Gas price has snapped the important 200-day Simple Moving Average (SMA) support near $2.53. With that break lower, Gas price is now trading below $2.50. With not much level to go on, the only next support near is still 8% lower, while the Relative Strength Index (RSI) is not yet nearing its oversold barrier.
The 200-day SMA turns now as a resistance, near $2.53. Once back above there, the pivotal level near $3.08 (March 6, 2023, high) remains key resistance after its false break last week, which is still 20% away. In addition, the red descending trendline in the chart below at $3.10 will also weigh on this area as a cap. Further up, the fresh year-to-date high at $3.16 is the level to beat.
On the downside, the next target could be the pivotal level near $2.13, with interim support by the 100-day SMA near $2.25
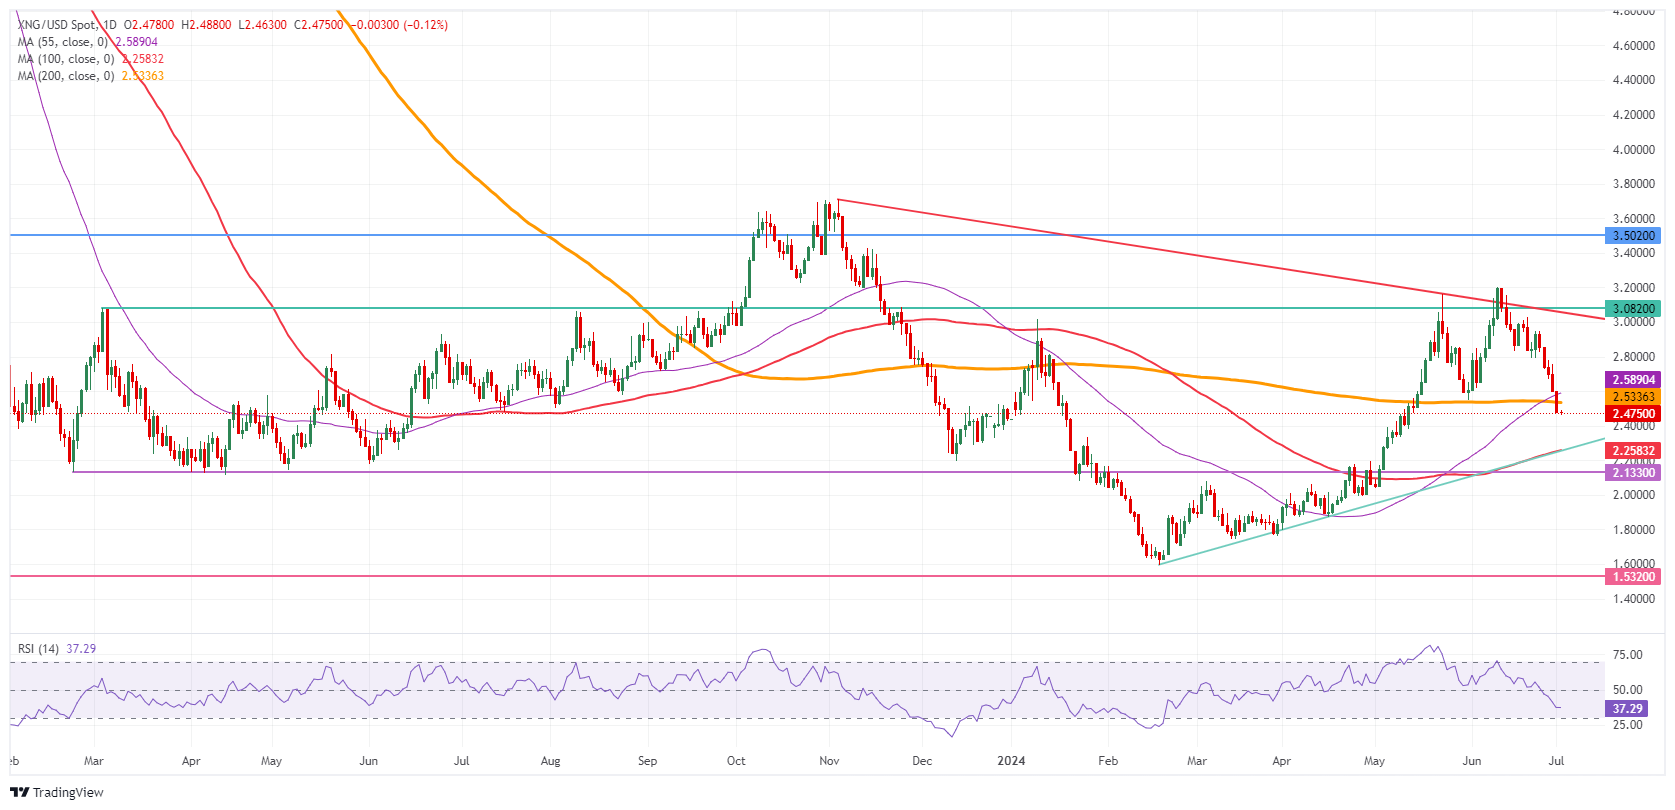
Natural Gas: Daily Chart
Natural Gas FAQs
Supply and demand dynamics are a key factor influencing Natural Gas prices, and are themselves influenced by global economic growth, industrial activity, population growth, production levels, and inventories. The weather impacts Natural Gas prices because more Gas is used during cold winters and hot summers for heating and cooling. Competition from other energy sources impacts prices as consumers may switch to cheaper sources. Geopolitical events are factors as exemplified by the war in Ukraine. Government policies relating to extraction, transportation, and environmental issues also impact prices.
The main economic release influencing Natural Gas prices is the weekly inventory bulletin from the Energy Information Administration (EIA), a US government agency that produces US gas market data. The EIA Gas bulletin usually comes out on Thursday at 14:30 GMT, a day after the EIA publishes its weekly Oil bulletin. Economic data from large consumers of Natural Gas can impact supply and demand, the largest of which include China, Germany and Japan. Natural Gas is primarily priced and traded in US Dollars, thus economic releases impacting the US Dollar are also factors.
The US Dollar is the world’s reserve currency and most commodities, including Natural Gas are priced and traded on international markets in US Dollars. As such, the value of the US Dollar is a factor in the price of Natural Gas, because if the Dollar strengthens it means less Dollars are required to buy the same volume of Gas (the price falls), and vice versa if USD strengthens.
Information on these pages contains forward-looking statements that involve risks and uncertainties. Markets and instruments profiled on this page are for informational purposes only and should not in any way come across as a recommendation to buy or sell in these assets. You should do your own thorough research before making any investment decisions. FXStreet does not in any way guarantee that this information is free from mistakes, errors, or material misstatements. It also does not guarantee that this information is of a timely nature. Investing in Open Markets involves a great deal of risk, including the loss of all or a portion of your investment, as well as emotional distress. All risks, losses and costs associated with investing, including total loss of principal, are your responsibility. The views and opinions expressed in this article are those of the authors and do not necessarily reflect the official policy or position of FXStreet nor its advertisers. The author will not be held responsible for information that is found at the end of links posted on this page.
If not otherwise explicitly mentioned in the body of the article, at the time of writing, the author has no position in any stock mentioned in this article and no business relationship with any company mentioned. The author has not received compensation for writing this article, other than from FXStreet.
FXStreet and the author do not provide personalized recommendations. The author makes no representations as to the accuracy, completeness, or suitability of this information. FXStreet and the author will not be liable for any errors, omissions or any losses, injuries or damages arising from this information and its display or use. Errors and omissions excepted.
The author and FXStreet are not registered investment advisors and nothing in this article is intended to be investment advice.


Recommended content
Editors’ Picks

EUR/USD accelerates losses to 1.0930 on stronger Dollar
The US Dollar's recovery regains extra impulse sending the US Dollar Index to fresh highs and relegating EUR/USD to navigate the area of daily troughs around 1.0930 in the latter part of Friday's session.

GBP/USD plummets to four-week lows near 1.2850
The US Dollar's rebound keep gathering steam and now sends GBP/USD to the area of multi-week lows in the 1.2850 region amid the broad-based pullback in the risk-associated universe.

Gold trades on the back foot, flirts with $3,000
Gold prices are accelerating their daily decline, steadily approaching the critical $3,000 per troy ounce mark as the Greenback's rebound gains extra momentum and US yields tighten their retracement.

Can Maker break $1,450 hurdle as whales launch buying spree?
Maker holds steadily above $1,250 support as a whale scoops $1.21 million worth of MKR. Addresses with a 100k to 1 million MKR balance now account for 24.27% of Maker’s total supply. Maker battles a bear flag pattern as bulls gather for an epic weekend move.

Strategic implications of “Liberation Day”
Liberation Day in the United States came with extremely protectionist and inward-looking tariff policy aimed at just about all U.S. trading partners. In this report, we outline some of the more strategic implications of Liberation Day and developments we will be paying close attention to going forward.

The Best brokers to trade EUR/USD
SPONSORED Discover the top brokers for trading EUR/USD in 2025. Our list features brokers with competitive spreads, fast execution, and powerful platforms. Whether you're a beginner or an expert, find the right partner to navigate the dynamic Forex market.