|

Natural Gas Price Analysis: Bulls headed to test prior support, focus is on the gap thereafter

  • Natural Gas is heading towards a 38.2% Fibonacci level.
  • A downside continuation to close the gap is eyed. 

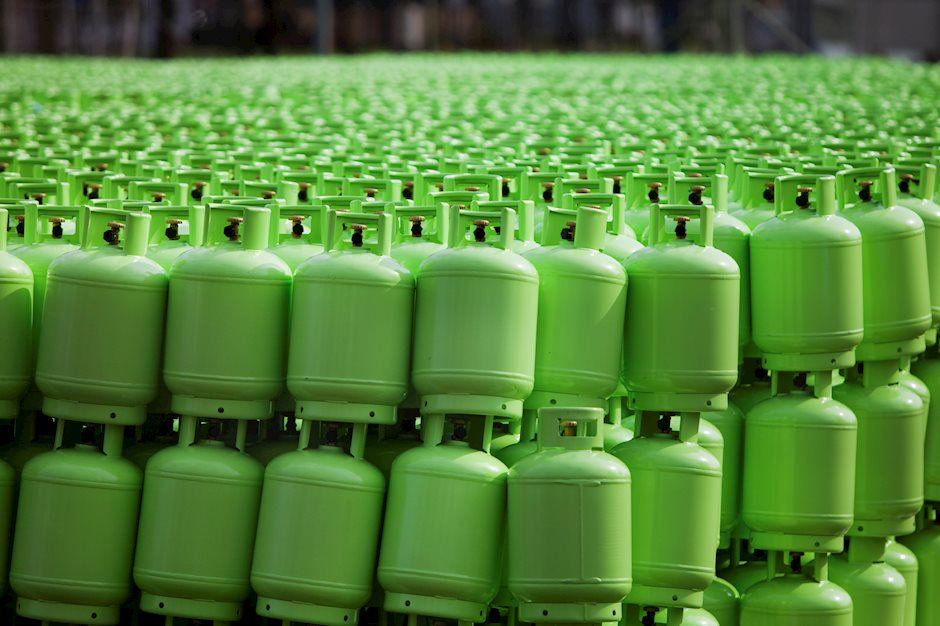
Natural Gas is playing out in a long drawn-out phase of what could be an accumulation albeit within a downtrend. The commodity is basing, for now, on the front side of the bearish trend but is sliding out of the micro bear trend which gives a meanwhile bias to the upside on the charts. The following illustrates this on the daily and 4-hour time frames. 

Nat Gas daily charts

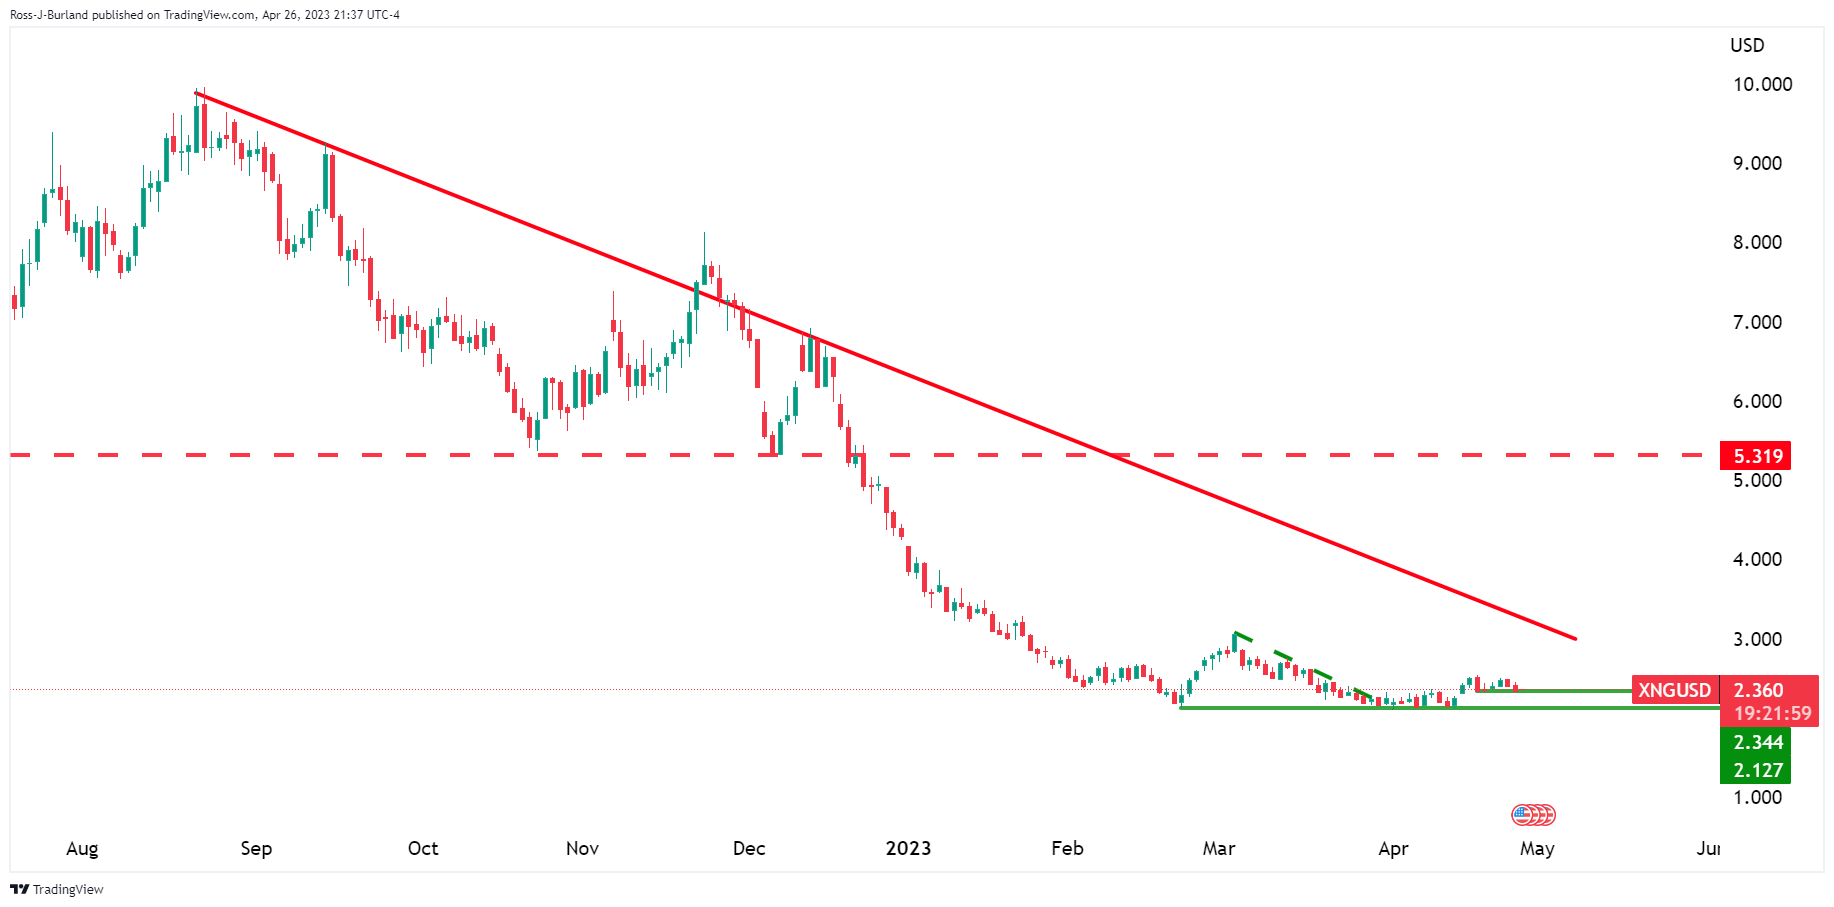
Zoomed in on the daily chart, we can see the accumulation taking place following the breakout of the downtrend, and then horizontal structure around 2.327. The price is meeting resistance but that is not to say there will not be an upside continuation after a restest of support. There is a gap to 2.282 that could be filled in due course. 
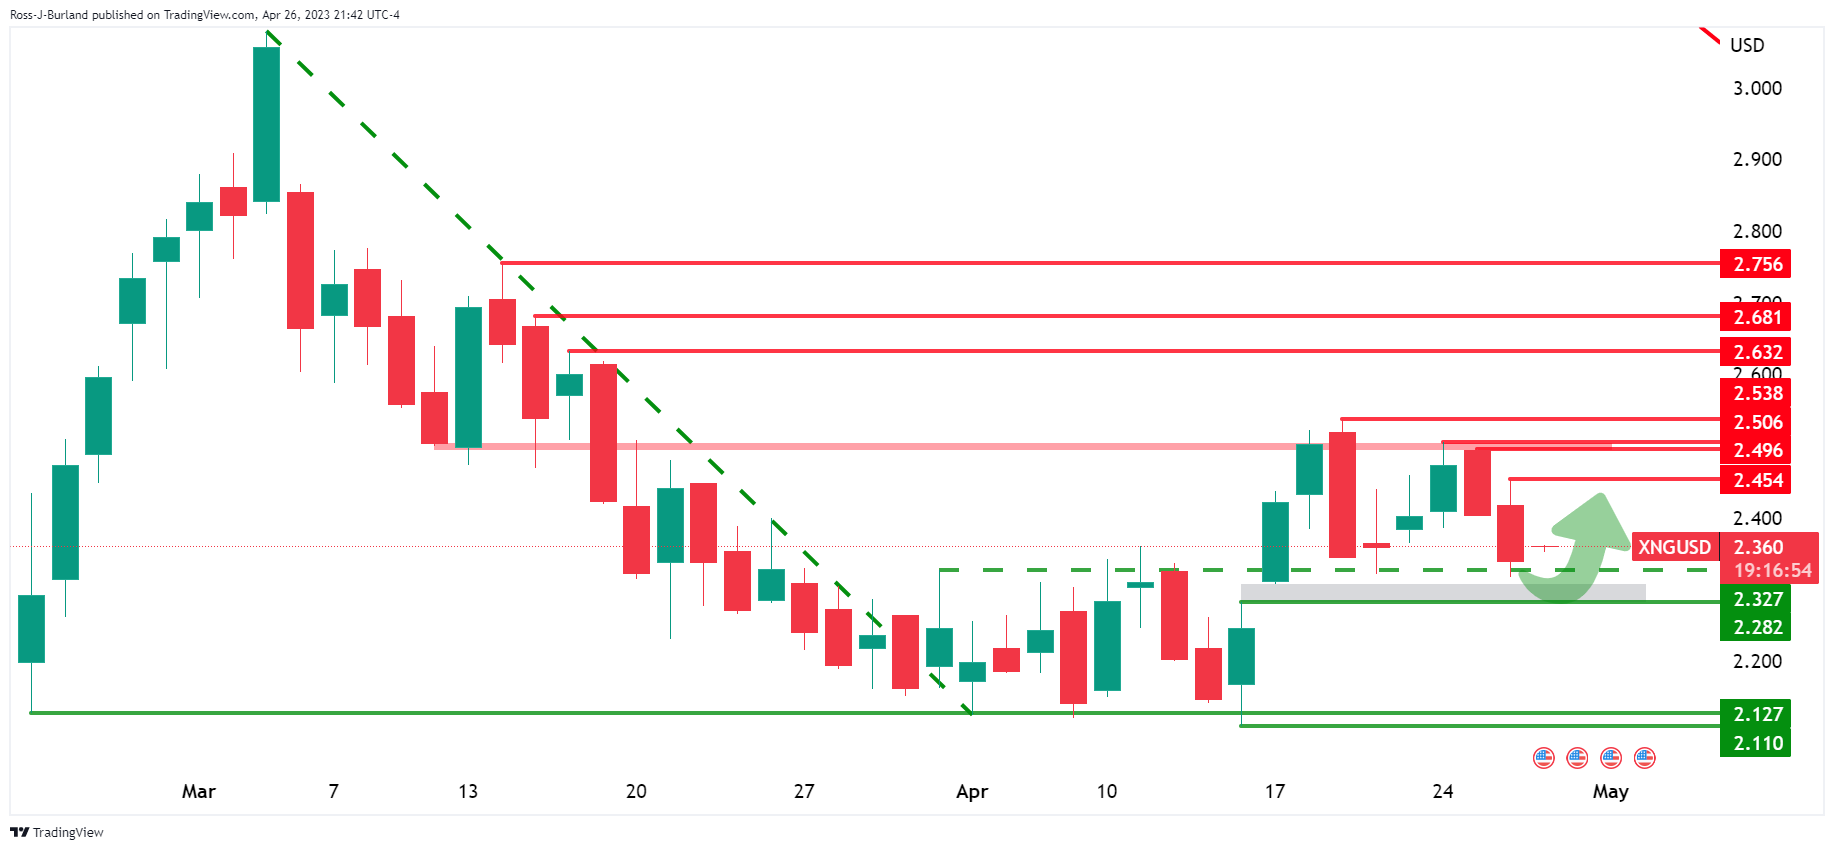
Nat Gas H4 chart

Zooming down to the 4-hour chart, we can see that the price is heading toward a 38.2% Fibonacci level and the 50% thereafter aligns with prior support, so this could act as resistance. Subsequently, a downside continuation to close the gap is a reasonable thesis for the sessions ahead. 

Author

Ross J Burland

Ross J Burland, born in England, UK, is a sportsman at heart. He played Rugby and Judo for his county, Kent and the South East of England Rugby team.

More from Ross J Burland
Share:

Editor's Picks

EUR/USD remains heavy near 1.1600 after hot EU inflation data

EUR/USD remains heavily offered near 1.1600, six-week lows, in the European session on Tuesday. The pair fails to find any inspiration from a surprise pick up in Eurozone inflation for February, as the US Dollar continues to attract safe haven flows amid escalating geopolitical tensions in the Middle East. 

GBP/USD attacks 1.3300, refreshing three-month lows

GBP/USD is deep in the red near 1.3300, accelerating its downside to renew three-month lows in European trading on Tuesday. The ongoing escalation in the Iran war, combined with rising Oil prices, weighs negatively on the higher-yielding Pound Sterling as the US Dollar capitalizes on increased haven demand.

Gold falls below $5,300 as stronger USD counter Middle East woes

Gold attracts some intraday selling and falls below $5,300 on Tuesday. The US Dollar climbs to a fresh high since January 20 and turns out to be a key factor exerting downward pressure on the commodity. However, concerns about a broader regional conflict in the Middle East continue to weigh on investors' sentiment and underpin demand for the traditional safe-haven bullion.

Stellar risks deeper losses as derivatives metrics turn negative

Stellar is trading red below $0.16 at the time of writing on Tuesday, after a slight recovery the previous day. Weakening derivatives data caps the recovery, while an unfavorable technical outlook projects a deeper correction for the XLM token in the upcoming days.

Middle East conflict ramps up a gear as energy price spike rips through markets

It’s another risk off day as geopolitical headwinds continue to batter financial markets. Although markets calmed during the US session and US stocks managed to post gains on Monday, this has not fed through to the European session, and stocks and bonds are sharply lower for a second day.

Hyperliquid Price Forecast: HYPE rises on commodities demand amid US-Iran war

Hyperliquid (HYPE) steadies above $33 at press time on Tuesday, marking its fourth consecutive day of recovery in a broadly volatile market due to the ongoing US-Israel strikes on Iran.