NASDAQ100: Will the next leg lower start soon?

We primarily use the Elliott Wave Principle (EWP) to forecast the financial markets, such as the NASDAQ100 (NDX). The EWP identifies the potential paths the market can take based on known patterns, which must adhere to price-based rules. Since we cannot predict the future, the EWP can help identify the path most likely to be followed. However, since financial markets are non-linear, stochastic, and probabilistic, we must, like any other forecasting discipline, always “anticipate, monitor, and adjust if necessary.”
On Monday, August 5, the index bottomed out at $17435 and has rallied relentlessly, with only one down day, Wednesday, August 7. It is up almost 12% since that low. So, the question now is, “What’s in store for the markets next?” Since we track this index daily for our premium members, we must take a step back for our new readers here at FXStreet to clarify how we came to where we are now. See Figure 1 below.
Figure 1. NDX daily chart with detailed EWP count and technical indicators
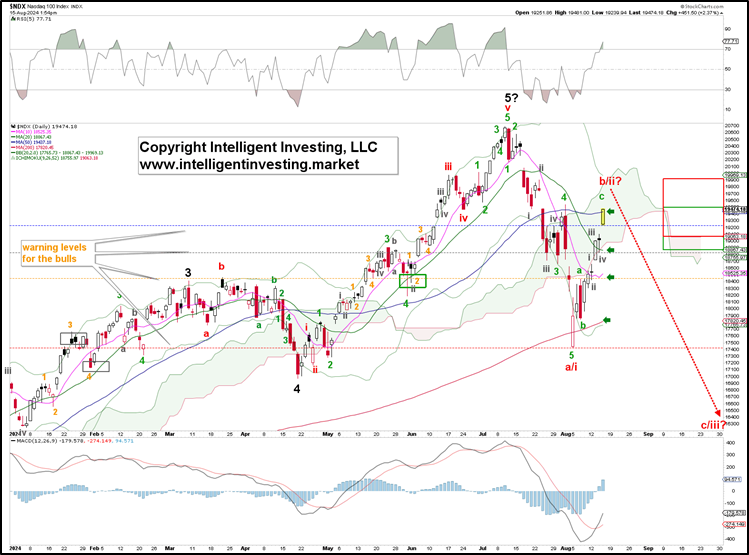
Namely, earlier this month, we anticipated a low at “ideally the support zone at $18200-400. From there, the red W-b/ii back to ideally a 50-76.4% retracement of the red W-a/i must be anticipated: $19300-800.“ Last Monday, August 5, the index bottomed out at $17435, 4.2% below the ideal target zone. Thus, we got the direction right but the magnitude wrong. However, the index rallied from there as expected and is now trading in the $19470s.
The red W-b/ii countertrend rally has reached the $19300-800 target zone, the 50-76.4% retracement of the red W-a/i. Moreover, the green W-c has also almost reached the 1.618x W-a extension at $19500, measured from the green W-b low. However, the green W-c doesn’t have to peak at that level and can easily extend to the $19800 region. Since the EWP is price-based, we have raised the Bulls’ colored warning levels to tell us below which price levels further upside becomes less likely. Due to last week's deeper-than-expected decline, our alternative scenario is that the decline comprised only three waves. See the red W-a, b, and c in Figure 2 below.
Figure 2. NDX daily chart with detailed EWP count and technical indicators
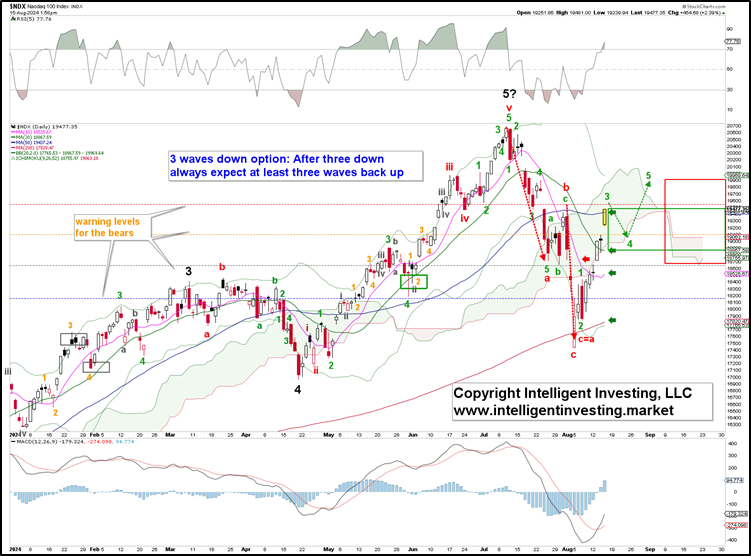
Namely, the index reached an almost perfect potential c=a target at last Monday's low. Three waves lower is often the hallmark of corrective price action. Thus, the index could work on a new impulse higher, the green waves 1-2-3-4-5, ultimately leading to new all-time highs. The green W-3 should wrap up, followed by a green W-4 and 5. Ideally, the former should stay above $18700 to allow the latter to reach $19950+/-50. However, given that we can count five larger waves up from the critical October 2022 low into the July high, which we will show in our next update, it -for now- remains our alternative scenario.
Author

Dr. Arnout Ter Schure
Intelligent Investing, LLC
After having worked for over ten years within the field of energy and the environment, Dr.


