NASDAQ100 update: Stick save by the bears?

In our previous update from three weeks ago, when the NASDAQ100 (NDX) was trading around $20000, we found that the index
“…had not breached below any of our warning levels for the Bulls, … all the technical indicators are still positive,… [and] the current trend is [therefore] still up.”
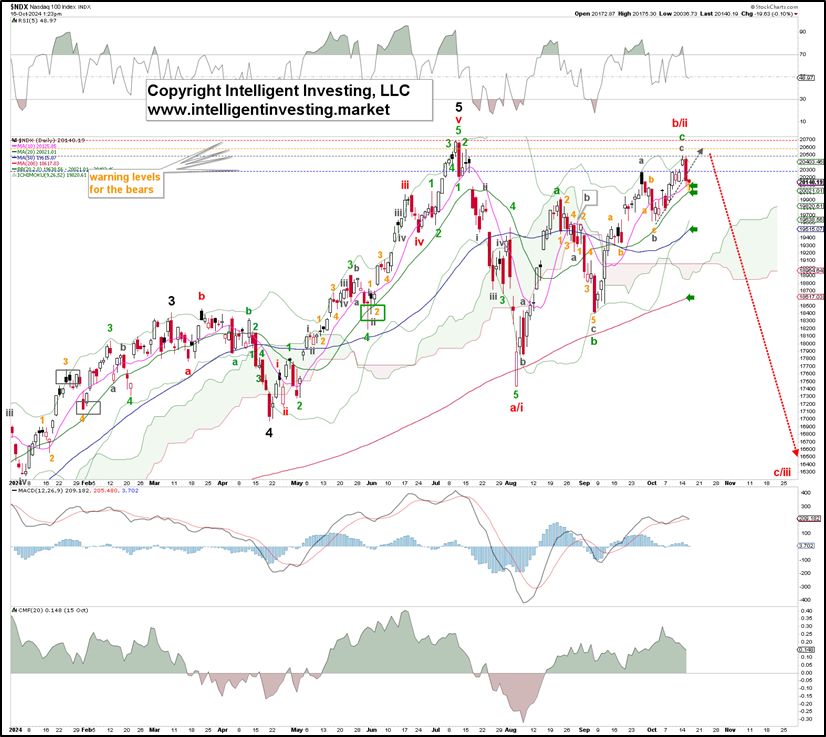
Fast forward, the index traded as high as $20490s earlier this week but now sits at around $20140. Based on a possible Elliott Wave (EW) count (see Figure 1 below), the index could still be wrapping up a counter-trend rally: the red W-b/ii, potentially targeting as high as $20600, assuming a standard (grey) W-c = W-a relationship. A break below the grey W-b, the October 1 low at $19622, would go a long way to confirm this thesis, with full confirmation below the September 6 low at $18400.
Figure 1. NDX daily chart with detailed Elliott Wave count and technical indicators
However, suppose the Bears cannot hold the index's price below the July all-time high, the red warning level (see our previous update for an explanation of these colored 4-tiered warning levels). In that case, we must focus on the alternative EWP count in Figure 2 below.
Figure 2. NDX daily chart with detailed Elliott Wave count and technical indicators
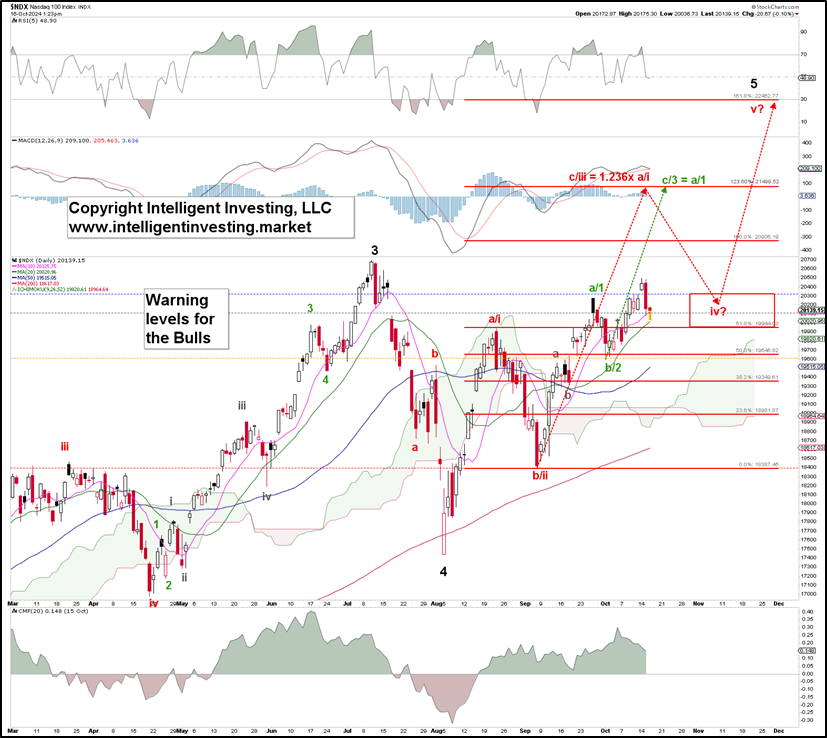
Namely, our interpretation of the EW count since the infamous October 2022 low, which is not shown, could be off by one wave degree. This means that the July ATH was not a final 5th wave top but a 3rd wave and that the August 5th low was not the start of a multi-year Bear market but a larger-degree (Major) W-4. Subsequently, the index is now in its final, more significant 5th wave: Major W-5, which is most likely morphing in an Ending Diagonal (ED).
In an ED, the 3rd wave (red W-iii) typically targets the 1.236x Fibonacci extension of the red W-i, measured from the red W-ii low, which resides at $21500. From there, a correction, red W-iv, can target typically, but not necessarily, the 61.8-76.% Fib-extension at $19940-20300 before the red W-v kicks in, to ideally the 161.8-176.4% Fib-extension at $22460-820. This path is contingent on holding above at least the October 1 low, especially the September 6 low.
The bottom line is that yesterday, the Bears broke the NDX’s price below the 1st (blue) warning level for the Bulls and are now sitting at the 2nd level. Thus, they have a shot at hammering out a multi-year top, but it requires a break below at least the October 1 low. Until then, all calls for “the top is in” are, although maybe after the fact correct, still technically premature. Especially since the index is still in a 100% Bullish uptrend, as defined in our previous update. A breakout above the recent July ATH will negate those plans, and we will look for $21500+ before the following correction should announce itself.
Author

Dr. Arnout Ter Schure
Intelligent Investing, LLC
After having worked for over ten years within the field of energy and the environment, Dr.


