|

Nasdaq 100 flirting with Fibos

The carnage on the market continues. Yesterday, stocks recorded quite a terrible day and most of them managed to secure the new, mid-term lows. In today’s analysis we’ll focus on the Nasdaq, which in its drop, is very technical.

If you’re buying stocks on the Nasdaq itself, probably you’re not enjoying the latest route, but if you’re a technical trader and you’re going with a bearish trend than you must be delighted.

What’s great about the price action of the Nasdaq is how it respects the Fibonacci levels. So, the top of the trend was in November and since then we’ve had a bearish correction, or a new bearish trend if you will.

Chart

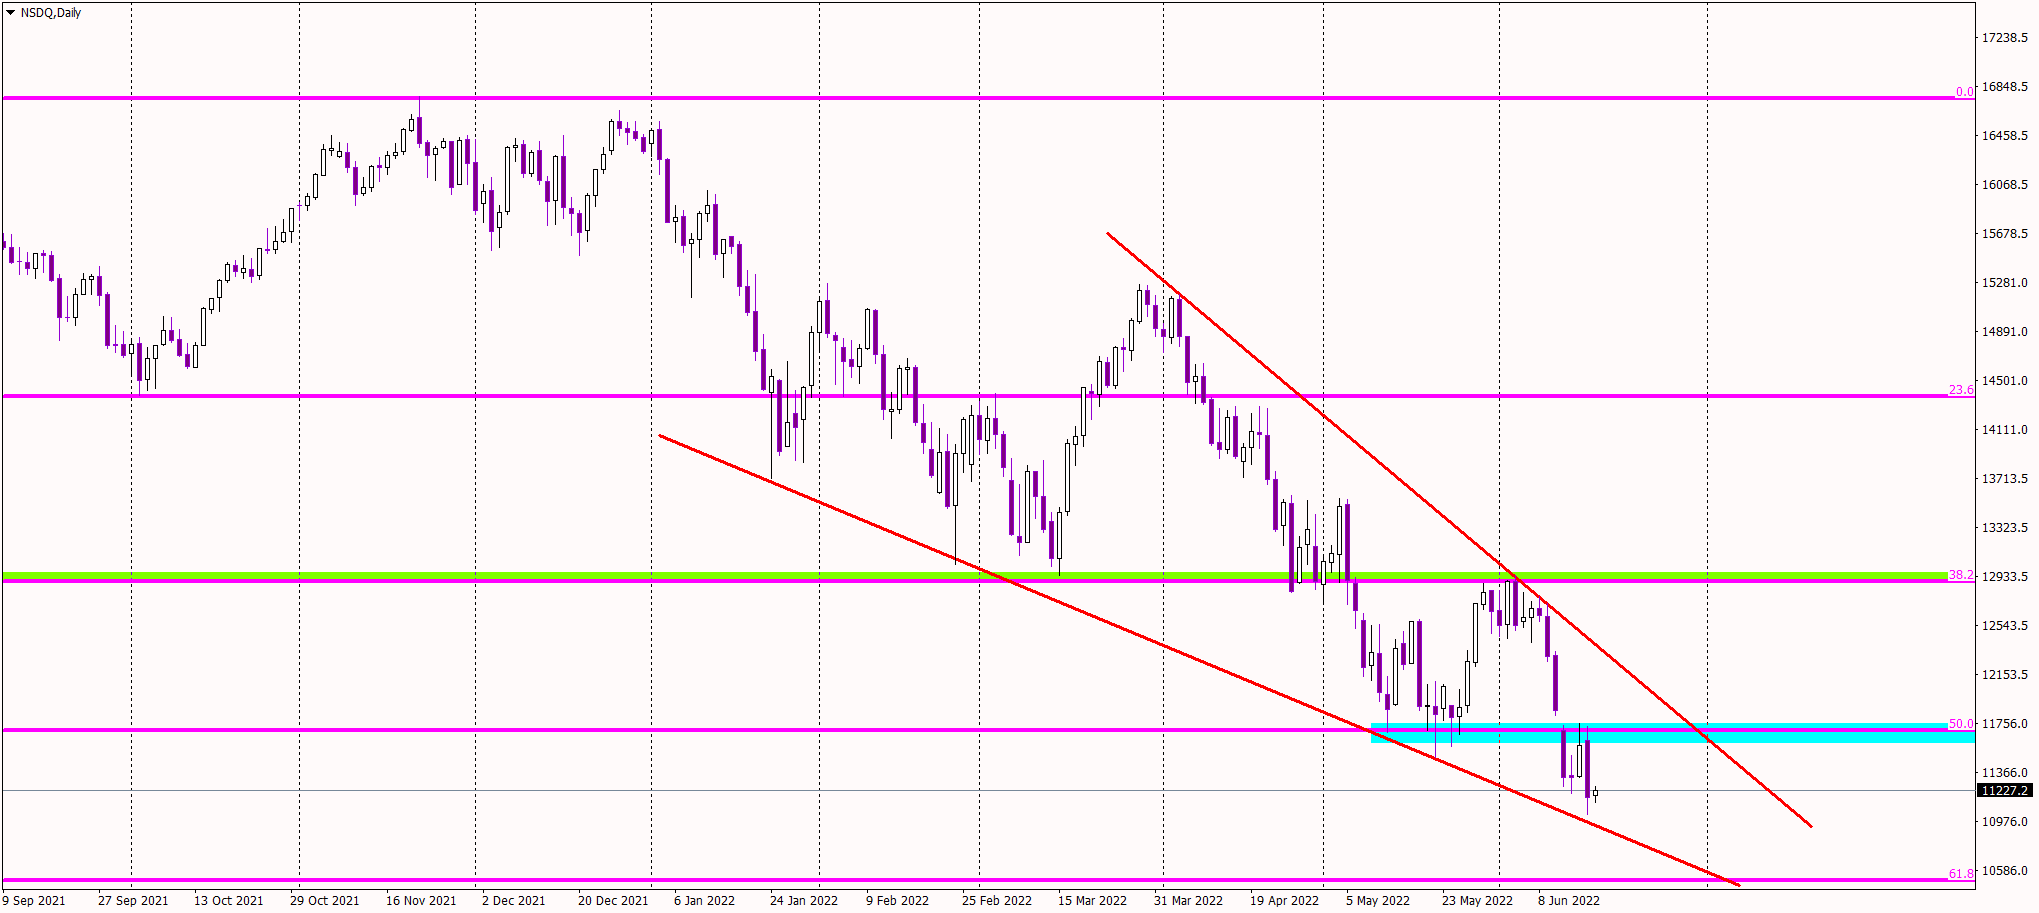
Since February, the price has started to respect Fibonacci retracements with great accuracy, which is only growing with time. Since April, the price has been pretty much only respecting Fibo: 38,2% (green) and 50% (blue). Most recently, the Nasdaq managed to break 50% and drop lower. The natural target for this movement is the 61,8% Fibonacci. Chances that we’ll get there are quite high.

It’s worth mentioning that all of this is happening inside of the wedge pattern (red lines) and the breakout of the upper line can be a first stage to a major buy signal. Current sentiment stays negative and most probably, the Nasdaq will test the 61,8% Fibo soon.

Author

Tomasz Wisniewski

Tomasz Wisniewski

Axiory Global Ltd.

Tomasz was born in Warsaw, Poland on 25th October, 1985.

More from Tomasz Wisniewski
Share:

Editor's Picks

EUR/USD extends its optimism past 1.1900

EUR/USD retains a firm underlying bid, surpassing the 1.1900 mark as the NA session draws to a close on Monday. The pair’s persistent uptrend comes as the US Dollar remains on the defensive, with traders staying cautious ahead of upcoming US NFP prints and CPI data.
 

GBP/USD tilts bullish as markets barrel toward mid-week NFP print

GBP/USD is holding a broader bullish structure on the daily chart, with price trading well above the 50 Exponential Moving Average at 1.3507 and the 200 EMA at 1.3310, confirming the intermediate uptrend that has been in place since the November 2025 low near 1.2300. 

Gold pushes back above $5,000

The daily chart shows spot Gold in a parabolic uptrend that accelerated sharply from the $4,600 area in late January, printing a record high at $5,598.25 before a violent reversal erased nearly $1,000 in value during the final days of the month. 

Litecoin eyes $50 as heavy losses weigh on investors

Following a strong downtrend across the crypto market over the past week, Litecoin holders are under immense pressure. The Bitcoin fork has trimmed about $1.81 billion from its market capitalization since the beginning of the year, sending it below the top 20 cryptos by market cap.

Japanese PM Takaichi nabs unprecedented victory – US data eyed this week

I do not think I would be exaggerating to say that Japanese Prime Minister Sanae Takaichi’s snap general election gamble paid off over the weekend – and then some. This secured the Liberal Democratic Party (LDP) an unprecedented mandate just three months into her tenure.

Ripple exposed to volatility amid low retail interest, modest fund inflows

Ripple (XRP) is extending its intraday decline to around $1.40 at the time of writing on Monday amid growing pressure from the retail market and risk-off sentiment that continues to keep investors on the sidelines.