NASDAQ Elliott Wave technical analysis [Video]
![NASDAQ Elliott Wave technical analysis [Video]](https://editorial.fxstreet.com/images/Markets/Equities/Nasdaq/new-york-stock-exchange-18404353_XtraLarge.jpg)
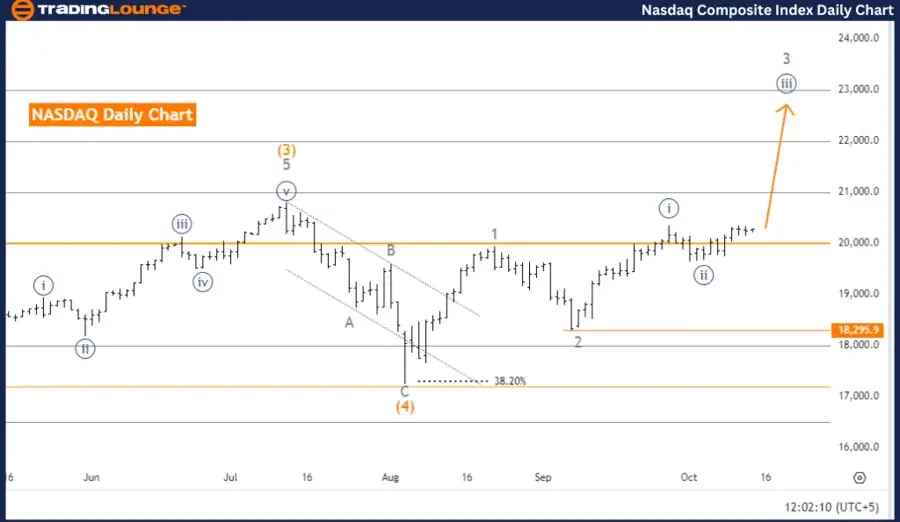
NASDAQ Elliott Wave Analysis Trading Lounge Day Chart.
NASDAQ Elliott Wave technical analysis
-
Function: Trend.
-
Mode: Impulsive.
-
Structure: Navy Blue Wave 3.
-
Position: Gray Wave 3.
-
Direction (next lower degrees): Navy Blue Wave 4.
-
Details: Navy Blue Wave 2 completed, Navy Blue Wave 3 in play.
-
Wave cancel invalid level: 18,295.9.
Analysis overview
The NASDAQ Elliott Wave analysis on the daily chart suggests the market is in a bullish trend with an impulsive wave structure, currently unfolding as navy blue wave 3. The ongoing movement places the market in gray wave 3, indicating the trend is gaining momentum in this advanced stage of the impulsive phase.
Wave structure and position
With navy blue wave 2 completed, the market is now progressing through navy blue wave 3, a wave associated with strong and sustained upward movement. According to Elliott Wave theory, this phase often indicates a continuation of the bullish trend. Once navy blue wave 3 concludes, the next phase will be navy blue wave 4, which might introduce a temporary correction before the broader uptrend resumes.
Key details
-
The market has completed navy blue wave 2 and is firmly in navy blue wave 3, suggesting the upward momentum will continue.
-
Wave Cancel Invalid Level: If the market drops below 18,295.9, the current wave count will be invalidated, requiring a revised analysis of the market structure.
Summary
The NASDAQ is in a strong upward trend, with navy blue wave 3 driving the current movement. Further gains are expected as long as the market remains above 18,295.9. Analysts should monitor for potential corrections as the market transitions into navy blue wave 4 in the near future.
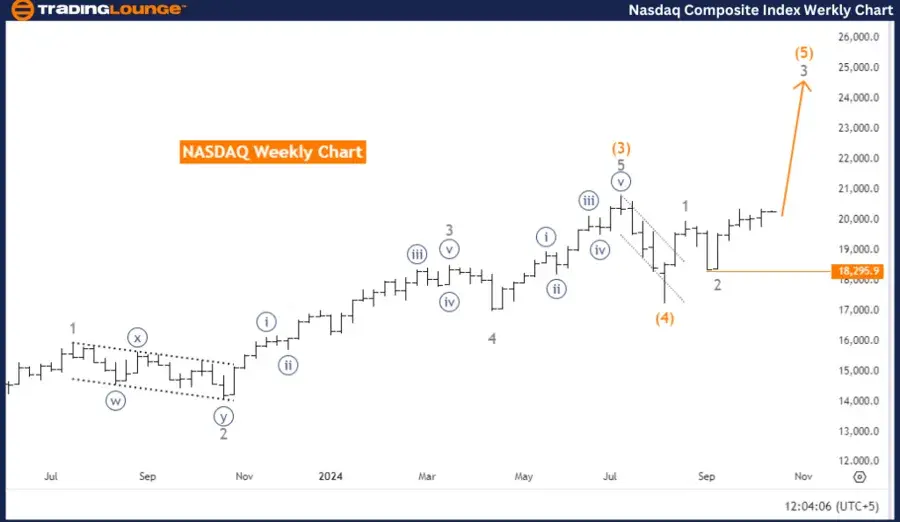
NASDAQ Elliott Wave Analysis Trading Lounge Weekly Chart
NASDAQ Elliott Wave technical analysis
-
Function: Trend.
-
Mode: Impulsive.
-
Structure: Gray Wave 3.
-
Position: Orange Wave 5.
-
Direction (next lower degrees): Gray Wave 4.
-
Details: Gray Wave 2 completed, Gray Wave 3 in play
-
Wave cancel invalid level: 18,295.9.
Analysis overview
The NASDAQ Elliott Wave analysis on the weekly chart shows the market is in a strong upward trend, characterized by an impulsive wave structure currently unfolding within gray wave 3. The position within the wave cycle places the market in orange wave 5, indicating the trend is advancing toward the later stages of this impulse sequence.
Wave structure and position
With gray wave 2 completed, the market is now progressing through gray wave 3, typically associated with robust bullish momentum. This suggests that the upward trend is likely to continue. Once gray wave 3 concludes, the market is expected to enter gray wave 4, introducing a temporary corrective phase before the overall bullish trend resumes.
Key details
-
Gray wave 3 is still unfolding, signaling further upward movement in the NASDAQ in the near term.
-
After the completion of gray wave 3, gray wave 4 is expected to bring a corrective pullback before the market continues its broader upward trajectory.
-
Wave Cancel Invalid Level: If the market falls below 18,295.9, the current Elliott Wave count will be invalidated, requiring a new wave analysis.
Summary
The NASDAQ is currently in a strong upward trend, with gray wave 3 driving the market higher. Traders should expect further gains while monitoring for a potential correction when the market transitions into gray wave 4. The bullish outlook remains valid as long as the market stays above 18,295.9.
Technical analyst: Malik Awais.
NASDAQ Elliott Wave technical analysis [Video]
Author

Peter Mathers
TradingLounge
Peter Mathers started actively trading in 1982. He began his career at Hoei and Shoin, a Japanese futures trading company.


