Nasdaq Elliott Wave technical analysis [Video]
![Nasdaq Elliott Wave technical analysis [Video]](https://editorial.fxstreet.com/images/Markets/Equities/Nasdaq/new-york-stock-exchange-18404353_XtraLarge.jpg)
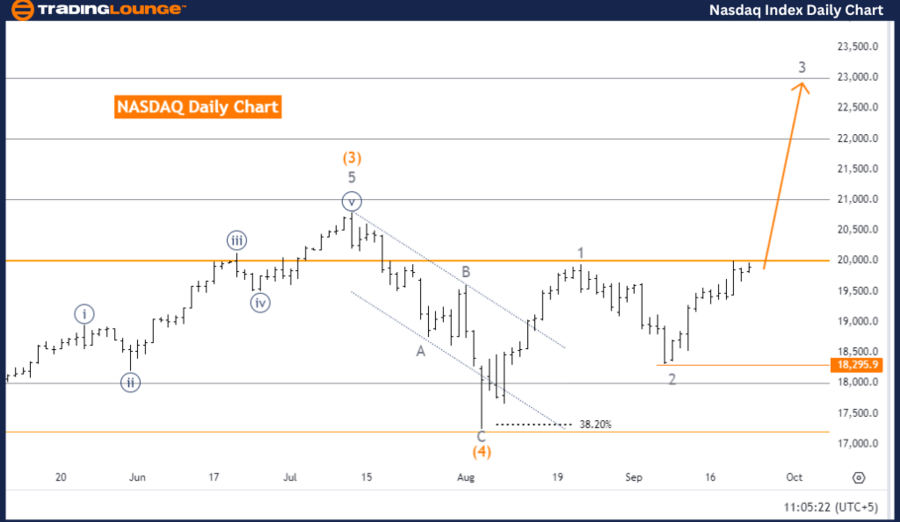
NASDAQ Elliott Wave Analysis Trading Lounge Day Chart.
Nasdaq Elliott Wave technical analysis
Function: Bullish Trend.
Mode: Impulsive.
Structure: Gray Wave 3.
Position: Orange Wave 5.
Next lower degree movement: Gray Wave 4.
Details: Gray Wave 2 completed, Gray Wave 3 of Orange Wave 5 in play.
Wave cancel invalid level: 18,295.9.
The NASDAQ Elliott Wave analysis on the daily chart shows that the market is currently in a bullish trend. The price action is moving in an impulsive mode, which is represented by the ongoing gray wave 3. This indicates a strong upward movement as part of a larger wave sequence, suggesting that the bullish trend is likely to continue.
Currently, the market is in orange wave 5, which typically signifies the final wave in a smaller sequence within the larger trend. This wave drives prices higher before a potential correction. After the completion of orange wave 5, the analysis anticipates a correction in the form of gray wave 4, marking the next lower degree movement.
The analysis also confirms that gray wave 2 has been completed, meaning that the market is now in gray wave 3 of orange wave 5. This indicates that the upward momentum is still strong, and prices continue to rise as part of the ongoing bullish trend. With the completion of gray wave 2, the previous corrective phase has ended, and the focus is now on the progress of gray wave 3.
The wave cancel invalidation level is set at 18,295.9, which means that if the price falls below this level, the current wave count and structure will be invalid, requiring a reassessment of the market’s trend direction.
Summary
The NASDAQ is in a bullish trend, with gray wave 3 of orange wave 5 in progress. As long as the price stays above 18,295.9, the upward trend is expected to continue, with a potential correction anticipated when gray wave 4 begins.
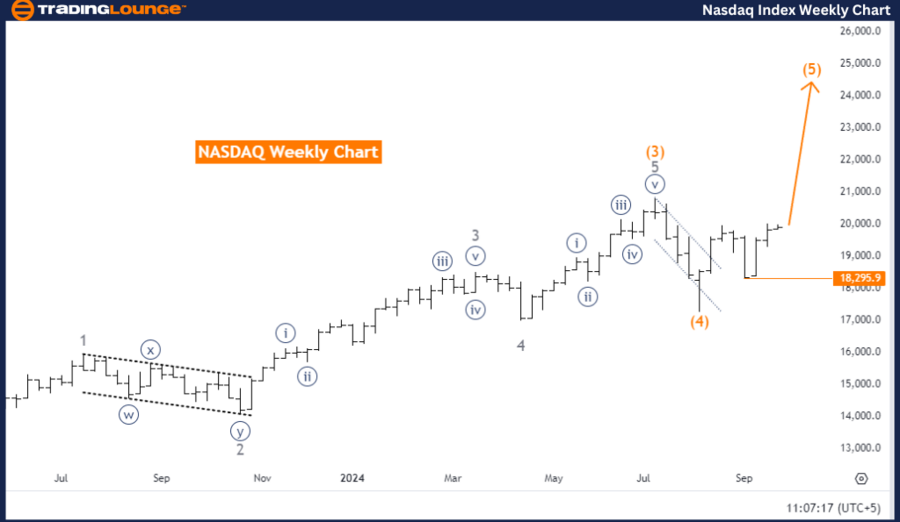
Nasdaq Elliott Wave analysis trading lounge weekly chart.
Nasdaq Elliott Wave technical analysis
Function: Bullish Trend.
Mode: Impulsive.
Structure: Orange Wave 5.
Next higher degree movement: Orange Wave 5 (Started).
Details: Orange Wave 4 completed, Orange Wave 5 in progress.
Wave cancel invalid level: 18,295.9.
The NASDAQ Elliott Wave analysis for the weekly chart confirms the market is in a bullish trend, advancing in an impulsive mode. The key structure in play is orange wave 5, which suggests that the market is currently in the final wave of a larger upward movement. This ongoing bullish wave indicates further price increases in the near term.
The analysis highlights that orange wave 4 has already been completed, which marks the end of a corrective phase in the broader trend. Now, orange wave 5 is underway, representing the continuation of the bullish trend. This wave is often the last phase in an impulse wave sequence, meaning that once orange wave 5 completes, a larger corrective phase could potentially follow.
The next higher degree movement confirms that orange wave 5 has already started, indicating the market is progressing within this final leg of the current bullish sequence. The ongoing wave suggests that upward momentum will likely persist. However, if the price drops below 18,295.9, the current wave structure would be invalidated, and a reassessment of the market trend would be necessary.
Summary
The NASDAQ weekly chart indicates a bullish trend with orange wave 5 currently unfolding. This wave suggests that the upward movement will continue as part of the impulsive structure. As long as the price remains above 18,295.9, the trend is expected to persist. Once orange wave 5 completes, a larger market correction may begin.
Nasdaq Elliott Wave technical analysis [Video]
Author

Peter Mathers
TradingLounge
Peter Mathers started actively trading in 1982. He began his career at Hoei and Shoin, a Japanese futures trading company.


