Nasdaq Elliott Wave technical analysis [Video[

NASDAQ Elliott Wave Analysis Trading Lounge Day Chart.
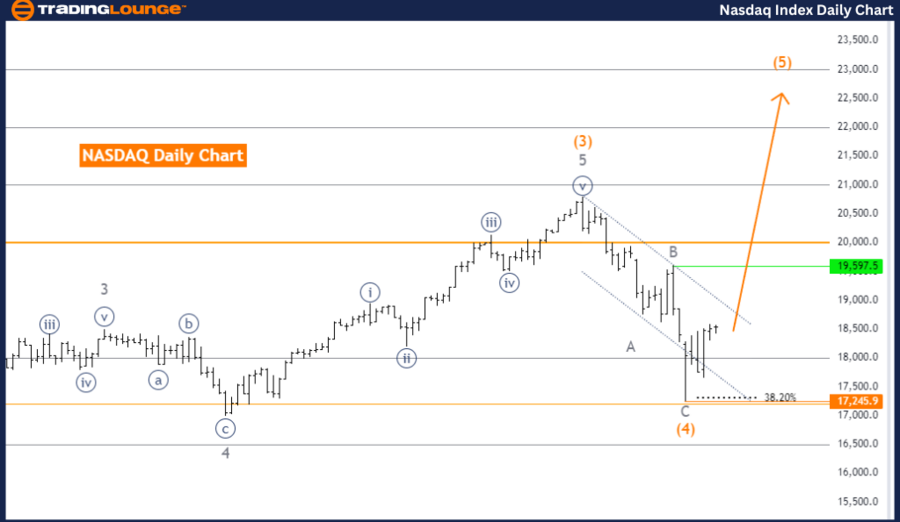
NASDAQ Elliott Wave technical analysis
Function: Trend.
Mode: Impulsive.
Structure: Orange Wave 5.
Direction next higher degrees: Orange Wave 5 (Initiated).
Details: Orange Wave 4 appears complete, transitioning into Orange Wave 5.
Wave cancel invalid level: 17245.9.
The NASDAQ Elliott Wave Analysis on the daily chart indicates a strong trend within an impulsive mode. The current structure is recognized as Orange Wave 5, which signifies that the market is in the final stage of a broader upward movement. This suggests that the trend is nearing its peak, with Orange Wave 5 being the concluding wave in this impulsive sequence.
The analysis confirms that Orange Wave 4 has concluded, marking the end of the previous corrective phase. With Orange Wave 4 now complete, the market has entered the final upward phase, identified as Orange Wave 5. Typically, this wave is characterized by a final push within the existing trend before the market potentially transitions into a significant correction or reversal.
The direction for the next higher degrees continues to emphasize Orange Wave 5, indicating that the upward trend remains active and is expected to persist until this wave fully completes. As Orange Wave 5 progresses, the market is anticipated to continue its upward movement, with the possibility of approaching a peak or overextension.
The wave cancel invalid level is set at 17245.9. This level is critical for maintaining the validity of the current Elliott Wave count. Should the market fall below this level, it would invalidate the current analysis, suggesting that the expected upward movement within Orange Wave 5 might not unfold as predicted. In such a case, a reevaluation of the wave structure and overall market outlook would be necessary.
In summary, the NASDAQ Elliott Wave Analysis on the daily chart indicates the market is in the final stages of an upward trend within Orange Wave 5. With Orange Wave 4 complete, the focus remains on the continuation of this trend, with a key invalidation level set at 17245.9.
NASDAQ Elliott Wave Analysis Trading Lounge Weekly Chart.
NASDAQ Elliott Wave Technical Analysis
Function: Trend.
Mode: Impulsive.
Structure: Orange Wave 5.
Direction next higher degrees: Orange Wave 5 (Initiated).
Details: Orange Wave 4 appears complete, transitioning into Orange Wave 5.
Wave cancel invalid level: 17245.9.
The NASDAQ Elliott Wave Analysis on the weekly chart reveals that the market is currently in a robust upward trend, characterized by an impulsive mode. The structure under analysis is Orange Wave 5, which indicates that the market is in the final phase of a broader upward movement. This wave represents the last significant push within the existing trend before a potential reversal or substantial correction.
According to the analysis, Orange Wave 4, the preceding corrective wave, appears to have completed. This completion signifies the transition from a corrective phase back into an impulsive phase, where the market resumes its upward trajectory within Orange Wave 5. The current focus is on the continuation of this upward movement, driven by the ongoing development of Orange Wave 5.
The direction for the next higher degrees remains aligned with the progression of Orange Wave 5, suggesting that the upward trend is still active and expected to persist until this wave fully unfolds. As Orange Wave 5 continues to evolve, the market is likely to experience further gains. However, given that this phase typically represents the latter stages of a broader trend, caution may be advisable as the wave approaches potential exhaustion.
The wave cancel invalid level is set at 17245.9, serving as a critical threshold for maintaining the validity of the current Elliott Wave count. If the market drops below this level, it would invalidate the current wave analysis, indicating that the expected continuation of the upward movement within Orange Wave 5 might not materialize as predicted. In such a scenario, a reassessment of the wave structure and overall market outlook would be necessary.
In summary, the NASDAQ Elliott Wave Analysis on the weekly chart highlights an ongoing upward trend within Orange Wave 5, following the completion of Orange Wave 4. The analysis emphasizes the continuation of this trend, with a key invalidation level set at 17245.9.

Technical analyst: Malik Awais.
NASDAQ Elliott Wave technical analysis [Video]
Author

Peter Mathers
TradingLounge
Peter Mathers started actively trading in 1982. He began his career at Hoei and Shoin, a Japanese futures trading company.


