Nasdaq Elliott Wave technical analysis [Video]
![Nasdaq Elliott Wave technical analysis [Video]](https://editorial.fxstreet.com/images/Markets/Equities/Nasdaq/yellow-taxi-in-times-square-of-new-york-city-manhattan-29728130_XtraLarge.jpg)
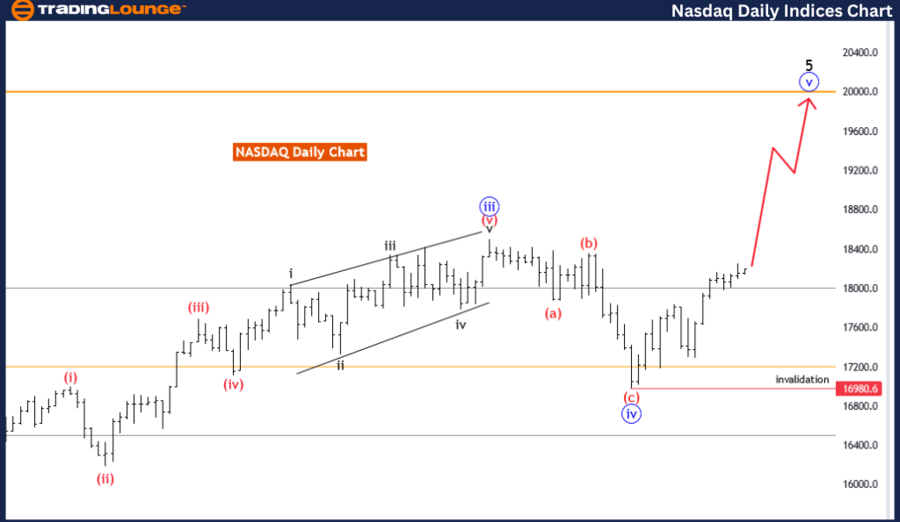
Nasdaq Elliott Wave Analysis Trading Lounge Day Chart,
Nasdaq Elliott Wave technical analysis
Function: Trend.
Mode: Impulsive.
Structure: Blue wave 5.
Position: Black wave 5 of red wave 3.
Direction next lower degrees: Red wave 4.
Details: blue wave 4 looking completed at 16980.6 .Now blue wave 5 of black wave 5 of 3 is in play . Wave Cancel invalid level: 16980.6
The NASDAQ daily chart provides insights into the Elliott Wave pattern governing the price movements of the NASDAQ Composite Index, indicating the prevailing market sentiment and potential future price direction.
Function: The function of the chart is identified as "Trend," suggesting that the NASDAQ Composite Index is currently experiencing a sustained directional movement over a period of time. This indicates that the market is likely undergoing a significant and prolonged price trend.
Mode: The mode highlighted in the analysis is "impulsive," indicating that the current price movement is characterized by strong momentum and decisive directional shifts. Impulsive waves typically represent phases of robust price advancement within the Elliott Wave sequence.
Structure: The structure outlined is "blue wave 5," which signifies the fifth and final wave of a larger-degree wave cycle. This implies that the NASDAQ is nearing the completion of a significant upward movement within the current Elliott Wave cycle.
Position: The position on the chart is identified as "Black wave 5 of red wave 3," indicating the specific wave count within the broader Elliott Wave pattern. This suggests that the market is currently in the midst of the fifth wave of a third-wave advance, which is often the most powerful and extended phase.
Direction for next lower degrees: The direction for the next lower degrees is specified as "red wave 4," suggesting that a corrective phase is anticipated following the completion of the current impulsive wave cycle. Corrective waves typically involve temporary price retracements or consolidations within the broader trend.
Details: The analysis notes that "blue wave 4" has likely completed its retracement, with the market now entering the final phase of the impulsive cycle, "blue wave 5." The wave cancellation or invalidation level is set at 16980.6, serving as a critical threshold. A breach of this level could potentially invalidate the current wave count, indicating a shift in market dynamics.
In summary, the NASDAQ daily chart suggests that the market is in an impulsive uptrend, with the completion of "blue wave 4" signaling the onset of the final wave, "blue wave 5." The wave cancellation level provides a key reference point for assessing the validity of the current wave count and anticipating potential trend reversals.
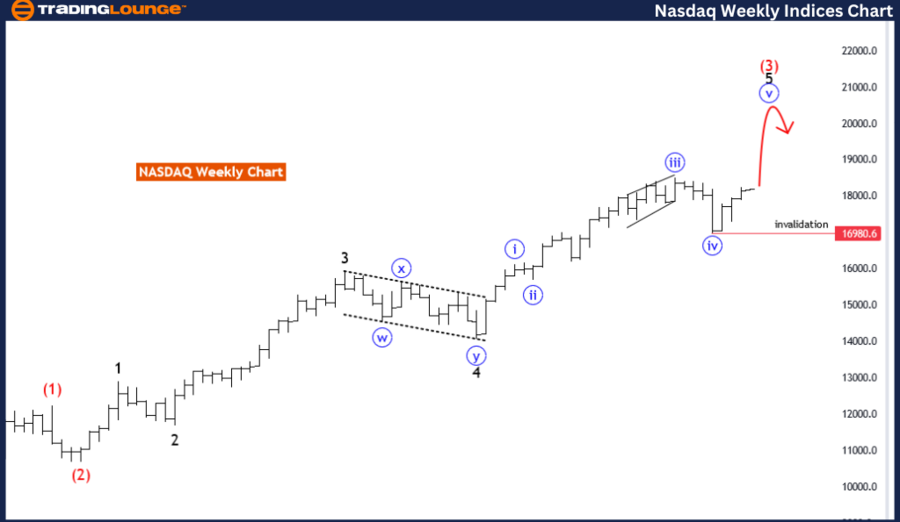
Nasdaq Elliott Wave analysis weekly chart
Function: Trend
Mode: Impulsive
Structure: Blue wave 5
Position: Black wave 5 of red wave 3
Direction next lower degrees: Red wave 4
Details: Blue wave 4 looking completed at 16980.6 .Now blue wave 5 of black wave 5 is in play . Wave Cancel invalid level: 16980.6
The weekly chart analysis of the NASDAQ provides a comprehensive view of the market's Elliott Wave pattern, offering valuable insights into the prevailing trends and potential future price movements.
Function: The function identified in the analysis is "Trend," indicating that the NASDAQ is currently experiencing a sustained directional movement over an extended period. This suggests that the market is in the midst of a significant and prolonged price trend.
Mode: The mode highlighted is "impulsive," signaling that the current price action is characterized by strong and decisive momentum. Impulsive waves typically represent phases of robust price advancement within the Elliott Wave sequence, indicating a strong bullish sentiment in the market.
Structure: The structure outlined is "blue wave 5," representing the fifth and final wave of a larger-degree wave cycle. This implies that the NASDAQ is approaching the culmination of a substantial upward movement within the current Elliott Wave cycle.
Position: The position specified on the chart is "Black wave 5 of red wave 3," indicating the specific wave count within the broader Elliott Wave pattern. This suggests that the market is currently advancing within the fifth wave of the third wave, which is often the most powerful and extended phase of an Elliott Wave cycle.
Direction for next lower degrees: The direction for the next lower degrees is identified as "red wave 4," implying that a corrective phase is anticipated following the completion of the current impulsive wave cycle. Corrective waves typically involve temporary price retracements or consolidations within the broader trend.
Details: The analysis notes that "blue wave 4" has likely completed its retracement, with the market now advancing in the final phase of the impulsive cycle, "blue wave 5." The wave cancellation or invalidation level is set at 16980.6, serving as a critical threshold. A breach of this level could potentially invalidate the current wave count, signaling a shift in market dynamics.
In summary, the weekly chart analysis of the NASDAQ suggests that the market is in an impulsive uptrend, with the completion of "blue wave 4" indicating the onset of the final wave, "blue wave 5." The wave cancellation level provides an essential reference point for assessing the validity of the current wave count and anticipating potential trend reversals.
Nasdaq Elliott Wave technical analysis [Video]
Author

Peter Mathers
TradingLounge
Peter Mathers started actively trading in 1982. He began his career at Hoei and Shoin, a Japanese futures trading company.


