Nasdaq 100: Is the current rally just a bounce or a new bull run?
Over 100 years of stock market history demonstrate that any Bear market/correction is a Major Buying Opportunity (BIMBO) for those looking beyond today and tomorrow. This time, it will be no different. Analyzing the stock market’s price charts objectively explains their condition and prevents bias and subjectivity, leading to irrational decisions. The Elliott Wave (EW) Principle is an indispensable tool for doing that. In our previous update, from April 8, we found that by using the EW for the NASDAQ100 (NDX)
“…once these two smaller waves are complete, we can look forward to two scenarios
A direct rally to new All-Time Highs [ATH] for the black W-5 … or
A bounce to $20,000+/-1000 before the next leg lower to ~$15,400 kicks in.
In short, expect at least three waves back up after three waves lower (the red W-a, -b, and -c). … For now, we focus on the index wrapping up these smaller 4th and 5th waves, followed by a rally of at least 15-25%.
Fast-forward: The index bottomed out on April 8 with a failed 5th wave and is now trading at around $19,140. See Figure 1 below. So far, so good. The price action over the last two weeks has been a bit of a “going back and forth,” but the smoke is now settling. Allow us to explain below.
Figure 1. NDX daily chart with detailed Elliott Wave count and technical indicators
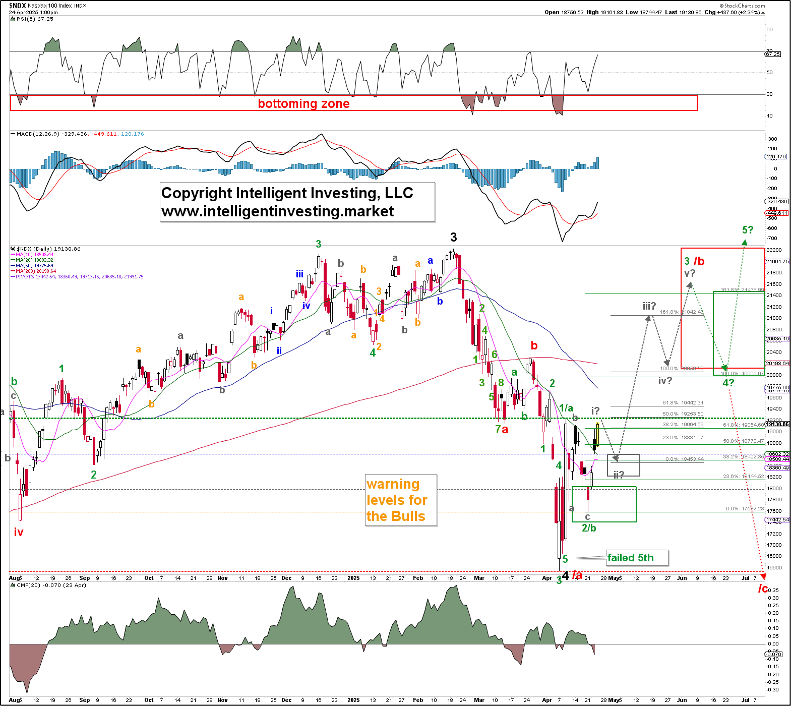
The April 9 rally was most likely green W-1/a, and the following seven days to this Monday’s low were green W-2/b. Now, the green W-3/c should be underway to ideally ~$21,400. Since 3rd and C-waves comprise five waves, we expect it to subdivide into the five grey waves i-ii-iii-iv-v as shown. However, we must see a breakout above the April 9 high (dotted green horizontal line) to confirm this path.
This brings us to the next issue. As we pointed out in our last update,
“… financial markets are stochastic and probabilistic, i.e., they follow if-then scenarios, and thus, those who seek certainty will never stop searching; we cannot yet be sure which path the index will take.
Thus, we cannot know at this stage if we will get five (green) waves up (1-5) or only three (a-b-c). Hence, why must we label the current advance 1/a, 2/b, 3/c, 4?, 5? Once the W-3/c is completed, we can determine whether the 4-5 sequence will materialize based on objective price levels. However, due to the recent rallies since April 8, which overlapped with the early March (red W-a) low, we know that the decline from the February high into the April low was only three waves: red W-a, -b, and -c, and thus corrective. See Figure 2 below.
Figure 2. NDX weekly chart with detailed Elliott Wave count and technical indicators
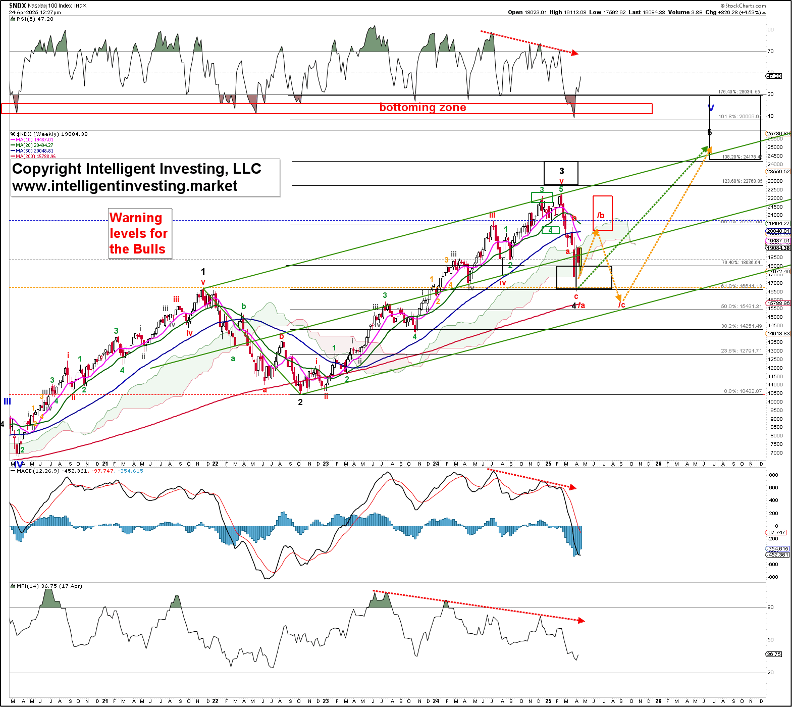
This means the index will rally to new all-time highs. But, as stated earlier, we don’t know yet exactly how, either directly per the green five-wave sequence (green dotted arrow in Figure 2) or via a detour, where the NDX stalls at around $21,400, falls back to ~$15,400, and then rallies to new ATHs (orange dotted arrow). Since we like to stay ahead of the market, we are tracking a few other metrics for our premium members to tell us beforehand which of the two it will be.
Author

Dr. Arnout Ter Schure
Intelligent Investing, LLC
After having worked for over ten years within the field of energy and the environment, Dr.


