Nasdaq 100 index Elliott Wave technical analysis [Video]
![Nasdaq 100 index Elliott Wave technical analysis [Video]](https://editorial.fxstreet.com/images/Markets/Equities/Nasdaq/nasdaq-website-17398480_XtraLarge.jpg)
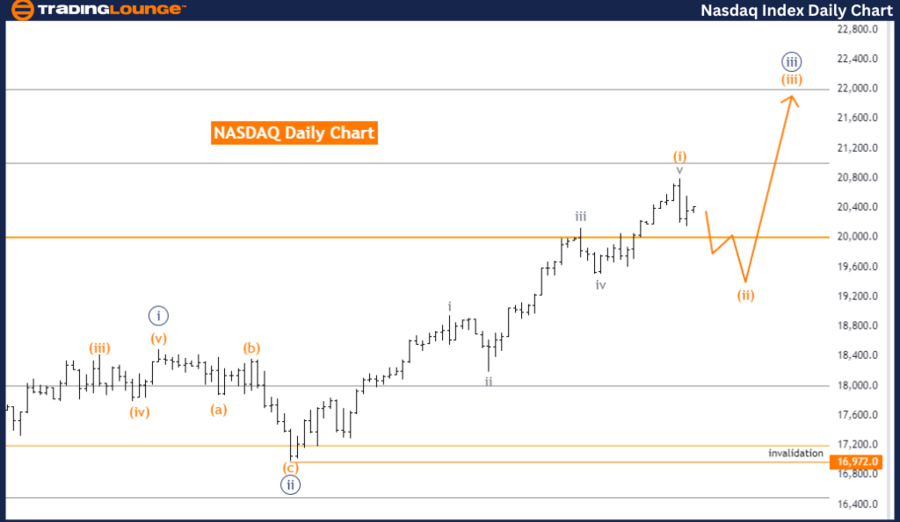
NASDAQ Elliott Wave Analysis Trading Lounge Day Chart.
NASDAQ Elliott Wave technical analysis
Function: Counter Trend.
Mode: Corrective.
Structure: Orange wave 2.
Position: Navy Blue Wave 3.
Direction next higher degrees: Orange wave 3.
Details:
-
Wave 1 Completion: Orange wave 1 is completed.
-
Current Phase: Orange wave 2 is active.
-
Wave Cancellation Invalid Level: 16972.0
The NASDAQ Elliott Wave Analysis for the day chart aims to identify the current market trend and wave structure. This analysis suggests a corrective counter-trend movement against the primary trend.
Currently, the wave structure under review is orange wave 2, positioned within navy blue wave 3. This indicates the market is undergoing a corrective phase within a larger impulsive wave. Orange wave 1 is completed, marking the end of the initial impulsive move within navy blue wave 3. Now, orange wave 2 is in play, retracing part of the previous impulsive move.
The direction for the next higher degrees is orange wave 3. After the completion of orange wave 2, the market is expected to resume its impulsive trend with orange wave 3, continuing the primary trend direction.
The analysis sets a wave cancellation invalid level at 16972.0, a crucial benchmark for traders. If the market price exceeds this level, the current wave count is invalidated. This level is vital for risk management, helping traders reassess their positions if the market moves unexpectedly.
Summary:
-
The NASDAQ day chart analysis indicates a corrective trend with orange wave 2 within navy blue wave 3.
-
Orange wave 1 is completed, and the market is in the corrective phase of orange wave 2.
-
The next expected direction is orange wave 3, following the completion of orange wave 2.
-
The wave cancellation invalid level at 16972.0 is crucial for maintaining the current wave count's validity and effective risk management.
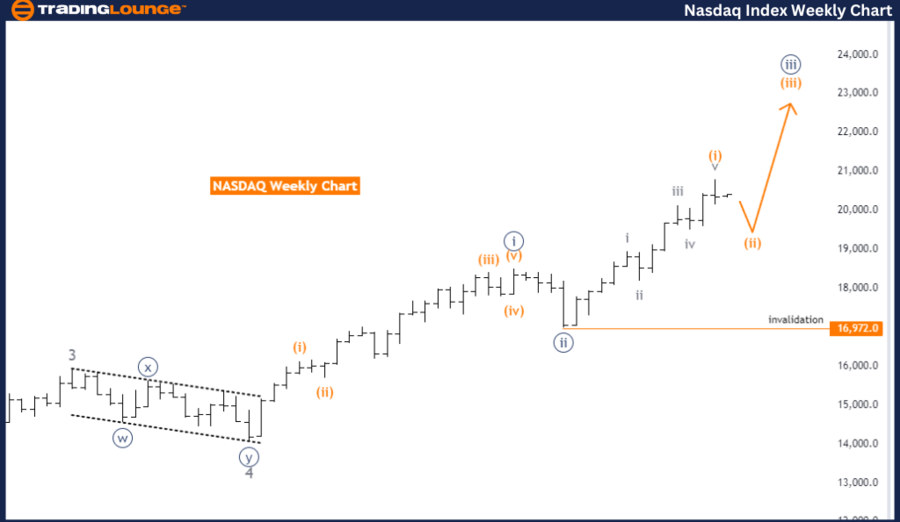
NASDAQ Elliott Wave Analysis Trading Lounge Weekly Chart.
NASDAQ Elliott Wave technical analysis
Function: Counter Trend.
Mode: Corrective.
Structure: Orange wave 2.
Position: Navy Blue Wave 3.
Direction next higher degrees: Orange wave 3.
Details:
-
Wave 1 Completion: Orange wave 1 is completed.
-
Current Phase: Orange wave 2 is active.
-
Wave Cancellation Invalid Level: 16972.0
The NASDAQ Elliott Wave Analysis for the weekly chart provides insights into the market's current behavior and wave structure. This analysis characterizes the market movement as a counter-trend, indicating a corrective phase within the broader trend.
The wave structure being examined is orange wave 2, which is part of navy blue wave 3. This suggests the market is in a corrective phase within a larger impulsive wave. The analysis indicates that orange wave 1 appears to have completed, marking the end of an initial impulsive move within navy blue wave 3. Following this, the market is now experiencing orange wave 2, a corrective wave that typically retraces some of the gains made during the impulsive wave 1.
The next higher degree direction is identified as orange wave 3. This implies that after the completion of orange wave 2, the market is expected to resume its impulsive trend with the start of orange wave 3. This phase would follow the corrective action of orange wave 2 and continue the primary trend.
A key element of this analysis is the wave cancellation invalid level, set at 16972.0. This level is crucial for traders as it serves as a benchmark to determine the validity of the current wave count. If the market price exceeds this level, the current wave count would be invalidated, necessitating a reassessment of the market conditions and potential repositioning. This invalidation point is important for risk management, providing a clear point at which traders should reconsider their analysis and strategies.
Summary:
-
The NASDAQ weekly chart analysis identifies a corrective trend characterized by orange wave 2 within navy blue wave 3.
-
Orange wave 1 is completed, and the market is in the corrective phase of orange wave 2.
-
The expected next phase is orange wave 3, following the completion of orange wave 2.
-
The wave cancellation invalid level at 16972.0 is critical for maintaining the current wave count's validity and for effective risk management.
Technical analyst: Malik Awais.
NASDAQ Elliott Wave technical analysis [Video]
Author

Peter Mathers
TradingLounge
Peter Mathers started actively trading in 1982. He began his career at Hoei and Shoin, a Japanese futures trading company.


