|

Nasdaq 100 ETF (QQQ) continues bearish move lower [Video]

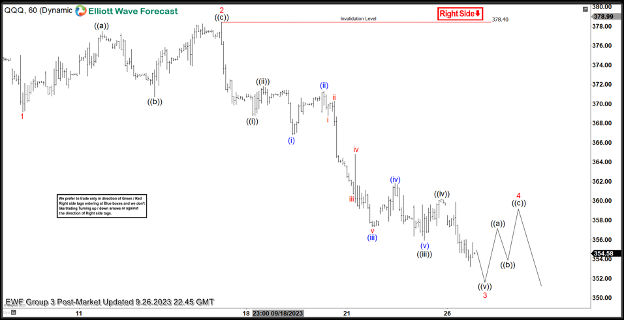
QQQ shows 3 swings lower from July 19, 2023 high favoring further downside to reach equal legs target. The drop from July 19 high is unfolding as a zig zag correction Elliott Wave structure. Down from July 19 high, wave (A) ended at 354.71 and wave (B) corrective rally ended at 381.05. Wave (C) lower is currently in progress as a 5 waves impulse structure. The ETF has broken below wave (A) August 18 low confirming the next leg lower has started.

Down from wave (B), wave 1 completed at 369.15. A zig zag wave 2 ended at 378.42. QQQ then continued lower in wave 3. Down from wave 2, wave ((i)) ended 368.74 and a small correction ended wave ((ii)) at 371.79. Market continued lower and wave ((iii)) finished at 355.93 and wave ((iv)) correction at 360.14. Currently, the market is developing wave ((v)) of 3 lower. Once wave 3 is completed, we expect 3, 7 or 11 swings higher in wave 4 before it resumes to the downside in wave 5 of (C). As far as pivot at 378.4 high stays intact, expect rally to fail for further downside. Potential target lower comes at 347.67 – 327.00 area (100% – 161.8% Fibonacci extension from wave (A).

QQQ 60 minutes Elliott Wave chart

QQQ Elliott Wave video

Author

Elliott Wave Forecast Team

Elliott Wave Forecast Team

ElliottWave-Forecast.com

More from Elliott Wave Forecast Team
Share:

Editor's Picks

EUR/USD holds lower ground near 1.1850 ahead of EU/ US data

EUR/USD remains in the negative territory for the fourth successive session, trading around 1.1850 in European trading on Friday. A broadly cautious market environment paired with modest US Dollar demand undermines the pair ahead of the Eurozone GDP second estimate and the critical US CPI data. 

GBP/USD keeps losses around 1.3600, awaits US CPI for fresh impetus

GBP/USD holds moderate losses at around 1.3600 in the European session on Friday, though it lacks bearish conviction. The US Dollar remains supported amid softer risk tone and ahead of the US consumer inflation figures due later in the NA session on Friday. 

Gold trims intraday gains to $5,000 as US inflation data loom

Gold retreats from the vicinity of the $5,000 psychological mark, though sticks to its modest intraday gains heading into the European session. Traders now look forward to the release of the US consumer inflation figures for more cues about the Fed policy path. The outlook will play a key role in influencing the near-term US Dollar price dynamics and provide some meaningful impetus to the non-yielding bullion.

US CPI data set to show modest inflation cooling as markets price in a more hawkish Fed

The US Bureau of Labor Statistics will publish January’s Consumer Price Index data on Friday, delayed by the brief and partial United States government shutdown. The report is expected to show that inflationary pressures eased modestly but also remained above the Federal Reserve’s 2% target.

A tale of two labour markets: Headline strength masks underlying weakness

Undoubtedly, yesterday’s delayed US January jobs report delivered a strong headline – one that surpassed most estimates. However, optimism quickly faded amid sobering benchmark revisions.

Solana Price Forecast: Mixed market sentiment caps recovery

Solana (SOL) is trading at $79 as of Friday, following a correction of over 9% so far this week. On-chain and derivatives data indicates mixed sentiment among traders, further limiting the chances of a price recovery.