Nasdaq 100 – A bear market is a major buying opportunity
As fear is running exceptionally high, irrational decisions are easily made. However, over 100 years of stock market history demonstrate that any Bear market is a Major Buying Opportunity (BIMBO) for those who can look beyond today and tomorrow. This time, it will be no different, as analyzing the stock market’s price charts provides an objective understanding of their condition. In our previous update from March 19, we found by using the Elliott Wave (EW) for the NASDAQ100 (NDX) that
“… [There is also] the potential for a bounce to $20800 ± 400, followed by a final leg lower (red W-c) to ideally $17800 ± 400. Thus, we prefer to look higher, contingent on holding above last week's low.”
The index reached a peak of $20,292 on March 25. Then its fast-moving C-Wave kicked in as a reaction to the Trump Administration’s tariff announcement on April 2nd. The index reached as low as $16,542 yesterday. Thus, the “bounce-and-drop” option became the preferred scenario. The bounce target zone was missed by only 0.5%, while the ideal downside target was exceeded by ~5% so far due to what we refer to as an extended 5th wave. Extensions of waves can always happen but cannot be known beforehand. Hence, we must start with the ideal Fibonacci-based impulse pattern, and when it is invalidated, we apply, in this case, an extended pattern. Therefore, “all we can do is anticipate, monitor, and adjust, if necessary.” See figure 1 below.
NDX daily chart with detailed Elliott Wave count and technical indicators
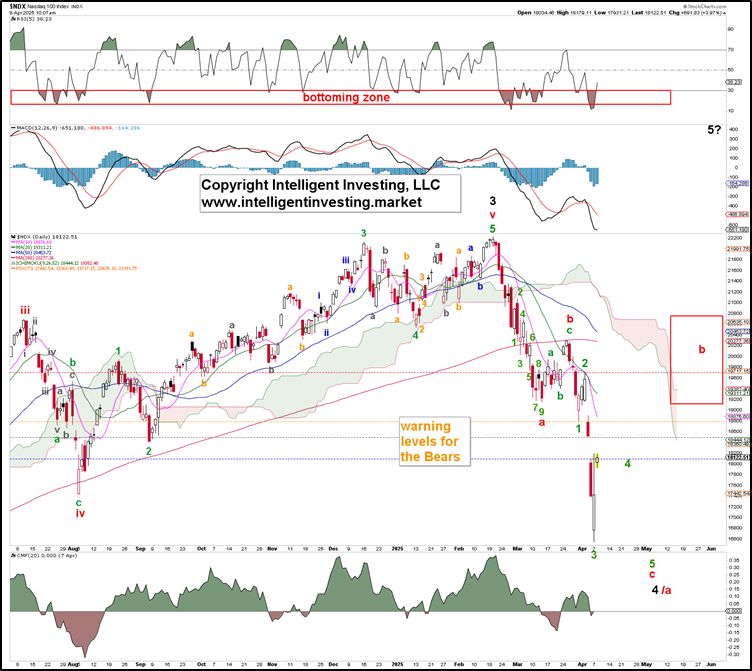
Since C-waves comprise five waves, last Monday’s low and Wednesday’s high were (green) Wave-1 and W-2, respectively. Thus, the green W-3 has bottomed, and all that’s left are the green W-4 and W-5, contingent on the NDX staying below last Wednesday’s high at $19,707. A severe warning for the Bears occurs above $18,799.
This brings us to the next issue. As we pointed out in our last update,
“even if the index would reach the 61.8% extension at ~$16,600, the Bull case would still be alive, albeit put under pressure as, in that case, the 5th wave can still reach the 161.8% extension at ~$26,500 to complete an enormous ending diagonal [ED] 5th wave from the March 2020 low.
In an ED, the 3rd wave often reaches the 1.236x Fibonacci (Fib) extension of W-1, measured from W-2. The subsequence fourth wave bottoms out at around 50-76.4%, with the 61.8% ideal. The final 5th wave then typically targets the 138.2-176.4% Fibonacci extension, with the 1.618x W-1 extension preferably. See Figure 2 below.
NDX daily chart with detailed Elliott Wave count and technical indicators
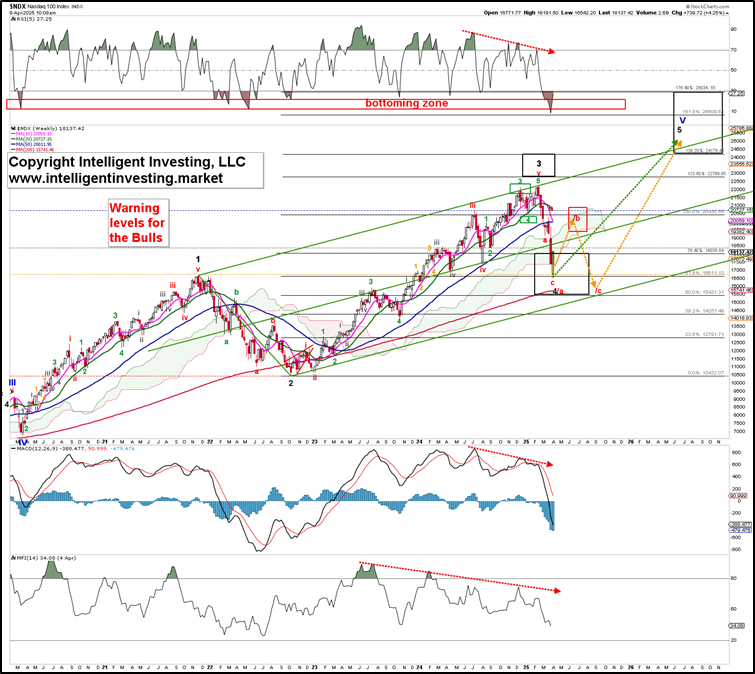
The NDX peaked at $22,222 in February, which is ~2.4% below the ideal 123.60% Fibonacci extension at $22,768 and thus within range. Moreover, so far, the index has bottomed out at $16,542, while the aforementioned (green) W-4, W-5 sequence targets ideally the low $16,000s, which is still within the margins of error of around $16,600. Thus, once these two smaller waves are complete, we can look forward to two scenarios
-
A direct rally to new All-Time Highs for the black W-5 (green arrow in Figures 1 and 2), or.
-
A bounce to $20,000+/-1000 before the next leg lower to ~$15,400 kicks in (orange arrows in Figures 1 and 2).
In short, after three waves lower (the red W-a, -b, and -c), expect at least three waves back up. Namely, financial markets are stochastic and probabilistic, i.e., they follow if-then scenarios, and thus, those who seek certainty will never stop searching; we cannot yet be sure which path the index will take. We do know, however, that a break below the 50% retracement level at $15,430 will be a serious indication the index has put in a much larger top, but we’ll share that in a later update if necessary. For now, we focus on the index wrapping up these smaller 4th and 5th waves, which will be followed by a rally of at least 15-25%.
Author

Dr. Arnout Ter Schure
Intelligent Investing, LLC
After having worked for over ten years within the field of energy and the environment, Dr.


