Nikkei 225 Elliott Wave technical analysis [Video]
![Nikkei 225 Elliott Wave technical analysis [Video]](https://editorial.fxstreet.com/images/Markets/Equities/Nasdaq/yellow-taxi-in-times-square-of-new-york-city-manhattan-29728130_XtraLarge.jpg)
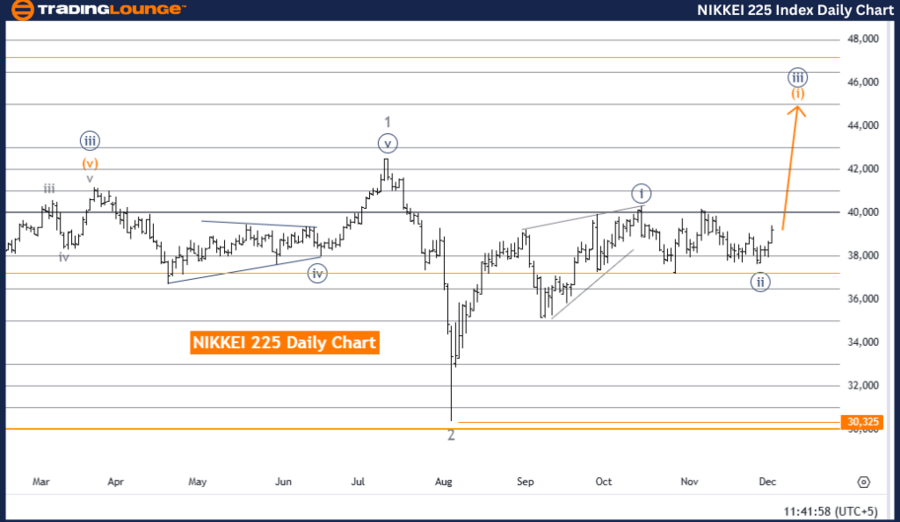
NIKKEI 225 (N225) Elliott Wave Analysis Trading Lounge Day Chart.
Nikkei 225 (N225) Elliott Wave technical analysis
-
Function: Bullish Trend.
-
Mode: Impulsive.
-
Structure: Orange Wave 1.
-
Position: Navy Blue Wave 3.
-
Direction next lower degrees: Orange Wave 2.
Details
The NIKKEI 225 daily chart reflects an Elliott Wave analysis indicating a bullish trend. The current wave structure is classified as orange wave 1, which is part of a broader impulsive sequence within navy blue wave 3.
The analysis suggests that navy blue wave 2 has likely concluded, paving the way for orange wave 1 of navy blue wave 3 to develop. This progression aligns with Elliott Wave Theory principles, which focus on identifying repetitive wave patterns to predict market trends.
Once orange wave 1 is complete, the next movement is expected to transition into orange wave 2 as part of the ongoing bullish trend.
Key levels
-
Wave Cancel Invalidation Level: 30,325
If the market drops below this level, the current wave analysis would need to be reconsidered, as it would suggest a potential deviation from the anticipated bullish structure.
Trading insights
The analysis offers traders a framework to anticipate upward price movements, highlighting the impulsive nature of the ongoing wave structure. The bullish outlook emphasizes the continuation of upward momentum, while the identified key levels provide clarity on confirming or invalidating the wave count.
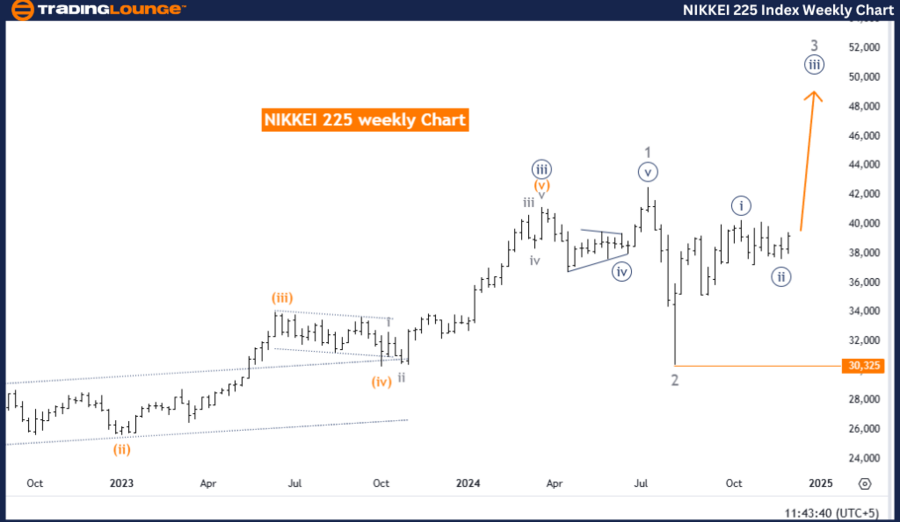
NIKKEI 225 (N225) Elliott Wave Analysis Trading Lounge Weekly Chart
Nikkei 225 (N225) Elliott Wave technical analysis
-
Function: Bullish Trend.
-
Mode: Impulsive.
-
Structure: Navy Blue Wave 3.
-
Position: Gray Wave 3.
-
Direction next lower degrees: Navy Blue Wave 3 (Started).
Details
The NIKKEI 225 weekly chart highlights an Elliott Wave analysis indicating a bullish trend. The current wave structure is identified as navy blue wave 3, forming a key part of a larger impulsive sequence within gray wave 3.
According to the analysis, navy blue wave 2 has likely concluded, marking the start of navy blue wave 3. This suggests the market is entering a strong upward phase, consistent with Elliott Wave Theory, which analyzes cyclical wave patterns to forecast market movements.
The next expected development is the continued progression of navy blue wave 3, in alignment with the overarching bullish impulsive trend.
Key levels
-
Wave Cancel Invalidation Level: 30,325
Should the market drop below this level, the current wave analysis would require reevaluation, as it would indicate a potential divergence from the anticipated bullish trend.
Trading insights
This analysis offers traders a comprehensive perspective on the market's upward trajectory, emphasizing the impulsive nature of the ongoing wave structure. It provides guidance on the continuation of bullish momentum and highlights critical levels and directional trends for effective decision-making in the coming weeks.
Technical analyst: Malik Awais.
Nikkei 225 (N225) Elliott Wave technical analysis [Video]
Author

Peter Mathers
TradingLounge
Peter Mathers started actively trading in 1982. He began his career at Hoei and Shoin, a Japanese futures trading company.


