In today’s update, we’ll revisit the Elliott Wave structure of Modine Manufacturing Co. ($MOD) and provide insights into the next phase of its price action. You can check the last article here. As anticipated, the 5-wave impulsive cycle from May 2023 has concluded, and a corrective pullback has begun. This pullback presents a potential buying opportunity in the coming weeks. Let’s break it down.

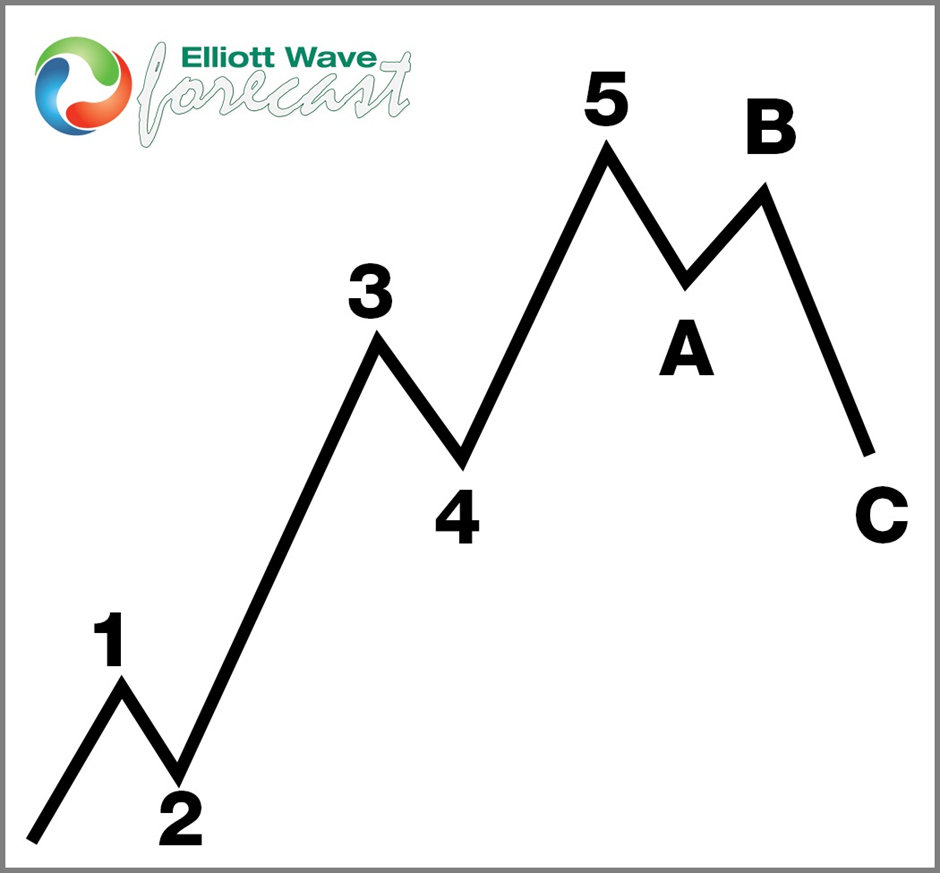
Five wave impulse structure + ABC correction

Chart

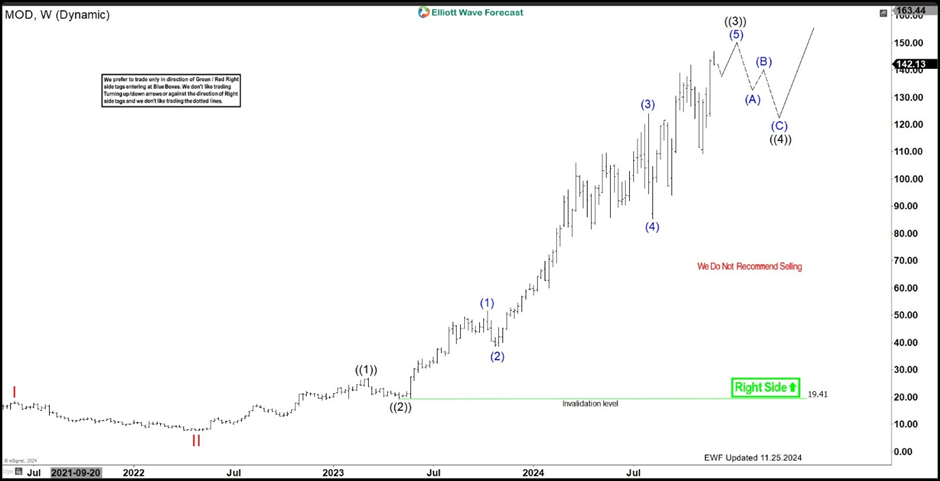
$MOD weekly Elliott Wave view November 25th 2024

Chart

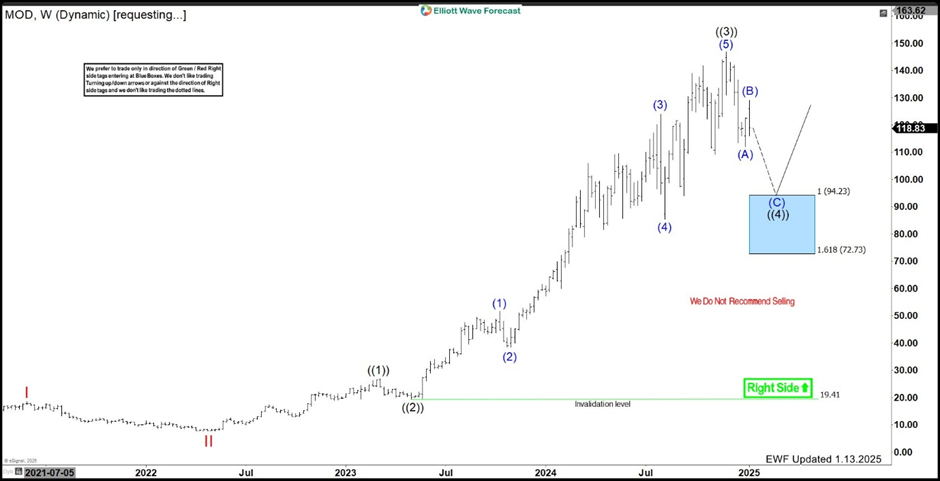
$MOD weekly Elliott Wave view January 13th 2025

Chart

Since our last update, $MOD has confirmed the completion of wave (5) within the broader wave ((3)). The stock has now entered a corrective phase, consistent with Elliott Wave Theory. Here’s how the structure is unfolding so far:

  1. The first leg lower, labeled wave (A), has already formed, marking the initial phase of the pullback.

  2. This was followed by a bounce in wave (B), which appears to have concluded.

  3. The stock is now likely entering wave (C) of the larger wave ((4)) correction, which should target the Blue Box area at $94.23–$72.73.

Blue Box area: A key buying opportunity

The Blue Box area represents a high-probability reversal zone where buyers could re-enter for the next bullish cycle. This correction, which follows the 5-wave impulse, allows the market to reset and create new opportunities for traders.

  • Blue Box Target Zone: $94.23–$72.73

  • Wave structure: Corrections typically unfold in 3 swings (ABC), with wave (C) often extending into the Blue Box.

As $MOD approaches this zone, traders should closely monitor price action for signs of reversal and a resumption of the larger uptrend.

What’s next for $MOD?

Once wave ((4)) completes in the Blue Box area, we expect $MOD to resume its bullish trend with a rally in wave ((5)). This next impulsive move could take the stock to new highs, continuing its long-term uptrend.

However, traders should exercise patience and wait for confirmation before entering new positions. Risk management is crucial, as corrections can sometimes extend beyond expected levels.

Key takeaways for traders

  1. Wave Completion: Wave (5) of ((3)) has ended, and the corrective pullback in wave ((4)) is underway.

  2. Current Focus: $MOD is trading lower in wave (C), targeting the Blue Box area between $94.23–$72.73.

  3. Buying Opportunity: The Blue Box offers a high-probability zone for buyers to re-enter before the next bullish wave ((5)).

  4. Long-Term Outlook: After completing wave ((4)), $MOD is expected to resume its larger uptrend, providing significant upside potential.

Conclusion

The current correction in Modine Manufacturing Co. ($MOD) aligns with our Elliott Wave analysis and offers a strategic buying opportunity. As the stock approaches the $94.23–$72.73 Blue Box, traders should prepare to capitalize on the next leg of the uptrend. Stay patient, focus on risk management, and let the Elliott Wave structure guide your decisions.

Keep an eye on $MOD’s price action as it progresses toward the Blue Box, and we’ll provide further updates as the market develops. Happy trading!

Share: Feed news

FURTHER DISCLOSURES AND DISCLAIMER CONCERNING RISK, RESPONSIBILITY AND LIABILITY Trading in the Foreign Exchange market is a challenging opportunity where above average returns are available for educated and experienced investors who are willing to take above average risk. However, before deciding to participate in Foreign Exchange (FX) trading, you should carefully consider your investment objectives, level of xperience and risk appetite. Do not invest or trade capital you cannot afford to lose. EME PROCESSING AND CONSULTING, LLC, THEIR REPRESENTATIVES, AND ANYONE WORKING FOR OR WITHIN WWW.ELLIOTTWAVE- FORECAST.COM is not responsible for any loss from any form of distributed advice, signal, analysis, or content. Again, we fully DISCLOSE to the Subscriber base that the Service as a whole, the individual Parties, Representatives, or owners shall not be liable to any and all Subscribers for any losses or damages as a result of any action taken by the Subscriber from any trade idea or signal posted on the website(s) distributed through any form of social-media, email, the website, and/or any other electronic, written, verbal, or future form of communication . All analysis, trading signals, trading recommendations, all charts, communicated interpretations of the wave counts, and all content from any media form produced by www.Elliottwave-forecast.com and/or the Representatives are solely the opinions and best efforts of the respective author(s). In general Forex instruments are highly leveraged, and traders can lose some or all of their initial margin funds. All content provided by www.Elliottwave-forecast.com is expressed in good faith and is intended to help Subscribers succeed in the marketplace, but it is never guaranteed. There is no “holy grail” to trading or forecasting the market and we are wrong sometimes like everyone else. Please understand and accept the risk involved when making any trading and/or investment decision. UNDERSTAND that all the content we provide is protected through copyright of EME PROCESSING AND CONSULTING, LLC. It is illegal to disseminate in any form of communication any part or all of our proprietary information without specific authorization. UNDERSTAND that you also agree to not allow persons that are not PAID SUBSCRIBERS to view any of the content not released publicly. IF YOU ARE FOUND TO BE IN VIOLATION OF THESE RESTRICTIONS you or your firm (as the Subscriber) will be charged fully with no discount for one year subscription to our Premium Plus Plan at $1,799.88 for EACH person or firm who received any of our content illegally through the respected intermediary’s (Subscriber in violation of terms) channel(s) of communication.

XM
Account
7.2
Tools
9.2
Service
9.4
Trading
9.0
Trust
7.0
Experience
8.4
Read review
Moneta Markets
Account
7.4
Tools
6.6
Service
8.0
Trading
6.6
Trust
5.2
Experience
9.2
Read review
Trading Pro
Account
7.2
Tools
5.2
Service
6.6
Trading
8.0
Trust
5.0
Experience
7.0
Read review
Pepperstone
Account
8.2
Tools
8.2
Service
7.4
Trading
9.0
Trust
8.8
Experience
9.0
Read review
XM
Read review
Moneta Markets
Read review
Trading Pro
Read review
Pepperstone
Read review
Trading Pro
Read review
Pepperstone
Read review
XM
Read review
Moneta Markets
Read review
Trading Pro
Account
7.2
Tools
5.2
Service
6.6
Trading
8.0
Trust
5.0
Experience
7.0
Read review
Pepperstone
Account
8.2
Tools
8.2
Service
7.4
Trading
9.0
Trust
8.8
Experience
9.0
Read review
XM
Account
7.2
Tools
9.2
Service
9.4
Trading
9.0
Trust
7.0
Experience
8.4
Read review
Moneta Markets
Account
7.4
Tools
6.6
Service
8.0
Trading
6.6
Trust
5.2
Experience
9.2
Read review

Recommended content


Recommended content

Editors’ Picks

Gold price jumps to fresh record high above $3,200 on US-China tariff war

Gold price jumps to fresh record high above $3,200 on US-China tariff war

Gold price sits at all-time highs of $3,219 in the Asian session on Friday. The weakening of the US Dollar and escalating trade war between the US and China provide some support to traditional safe haven asset Gold price amid increased dovish Fed expectations. 

Gold News
USD/JPY recovers losses in sync with US Dollar, retakes 143.50

USD/JPY recovers losses in sync with US Dollar, retakes 143.50

USD/JPY is trimming losses to retest 143.50 in Asian trading hours on Friday, having tested levels under 143.00. The pair is tracking the US Dollar price action amid persistent trade jitters and US recession fears. The Fed-BoJ divergent policy expectations support the Japanese Yen, keep the weight intact on the pair.  

USD/JPY News
AUD/USD consolidates weekly gains near 0.6250 despite trade tensions

AUD/USD consolidates weekly gains near 0.6250 despite trade tensions

AUD/USD consolidates weekly gains near 0.6250 in Asian trading on Friday. The pair capitalizes on sustained US Dollar weakness even as risk aversion remains at full steam on deepening US-China trade war. The White House confirmed on Thursdayt that the cumulative US tariffs on Chinese goods have risen to 145%.

AUD/USD News
Can Trump's tariff pause and declining inflation keep Bitcoin afloat? Experts weigh in

Can Trump's tariff pause and declining inflation keep Bitcoin afloat? Experts weigh in

Bitcoin dived below $80,000 on Thursday despite US Consumer Price Index data coming in lower than expected and President Donald Trump's 90-day reciprocal tariffs pause on 75 countries.

Read more
Trump’s tariff pause sparks rally – What comes next?

Trump’s tariff pause sparks rally – What comes next?

Markets staged a dramatic reversal Wednesday, led by a 12% surge in the Nasdaq and strong gains across major indices, following President Trump’s unexpected decision to pause tariff escalation for non-retaliating trade partners. 

Read more
The Best brokers to trade EUR/USD

The Best brokers to trade EUR/USD

SPONSORED Discover the top brokers for trading EUR/USD in 2025. Our list features brokers with competitive spreads, fast execution, and powerful platforms. Whether you're a beginner or an expert, find the right partner to navigate the dynamic Forex market.

Read More

Forex MAJORS

Cryptocurrencies

Signatures

Best Brokers of 2025