Middle East tensions, possible US recession send stocks plunging at Monday open
- US government says Iran, Hezbollah attack on Israel imminent.
- VIX jumps 172% to level not seen since early covid pandemic.
- NASDAQ, S&P 500 open hundreds of basis points lower.
- Market fright arrives on heels of Friday sell-off caused by poor jobs report.
- Bitcoin sinks 17% in 24 hours as crypto faces same flight to safety.

Folks, we’re panicking here. The Middle East is ablaze with tension again on Monday after the US government said that an attack by Hezbollah and Iran on Israel is imminent. Though no attack has happened yet, any attack would thrust the US military back into war mode in an attempt to aid Israel, which has faced international condemnation for bombing Palestinian civilians in Gaza for the last 10 months.
This abrupt change in the status quo comes on the heels of Friday’s major fumble when the July Nonfarm Payrolls report showed a steep dropoff in US hiring. Many observers think the sudden contraction in what has been a healthy labor market all year is the start of a recession, and the market on Friday raised the odds from one Federal Reserve (Fed) interest rate cut to three being priced in for 2024.
The VIX, which measures expectations for volatility and fear in the market, leapt 172% near the market open to a level not seen since the early weeks of the covid pandemic in 2020. The NASDAQ has sunk 3.3% at the time of writing, although it was initially worse at the open. The S&P 500 is down 2.7%, while the Dow Jones has lost 2.4%. Bitcoin has lost as much as 17% as well, sinking to $50,000.
Stock market reels as large caps lose summer gains
Many of the large-cap players are beginning to recover form the mayhem. Apple (AAPL) fell to $196 near the open but then clawed back enough gains to reach $109. Microsoft (MSFT) opened near $388 but has likewise risen to $395. Amazon (AMZN) has lost about 5% at the time of writing.
Nvidia (NVDA) opened at $92.06, down more than 14%, but rose back to $100 by 10:00am EST. The chip giant and leader among AI stocks received bad news on the analyst front as Citi's Atif Malik reported rumors that Nvidia would delay the release of its Blackwell chips. Malik cut his outlook for 2025 revenue by 5% but retained his $150 price target and Buy rating.
US Treasury yields got in on the action as equity sellers used their cash to buy US government debt. The 2-year/10-year yield curve un-inverted for the first time since 2022. Treasury yields dropped below 3.8% for the first time in years.
The market slump has placed the spotlight on the few well-known bears, such as Morgan Stanley’s Mike Wilson. Remembered for correctly predicting the market rout in 2022, Wilson is not concerned with the Middle East but thinks the post-pandemic rally that began last year is largely running on fumes since consumers have spent much of their savings.
“The bottom line is that the consumer has been weakening this year,” Wilson wrote in a client note recently. “The risk-reward for equities broadly remains unfavorable. At this stage, it’s hard to argue that many stocks are cheap if earnings revisions don’t turn around in a definitive manner.”
Nasdaq FAQs
The Nasdaq is a stock exchange based in the US that started out life as an electronic stock quotation machine. At first, the Nasdaq only provided quotations for over-the-counter (OTC) stocks but later it became an exchange too. By 1991, the Nasdaq had grown to account for 46% of the entire US securities’ market. In 1998, it became the first stock exchange in the US to provide online trading. The Nasdaq also produces several indices, the most comprehensive of which is the Nasdaq Composite representing all 2,500-plus stocks on the Nasdaq, and the Nasdaq 100.
The Nasdaq 100 is a large-cap index made up of 100 non-financial companies from the Nasdaq stock exchange. Although it only includes a fraction of the thousands of stocks in the Nasdaq, it accounts for over 90% of the movement. The influence of each company on the index is market-cap weighted. The Nasdaq 100 includes companies with a significant focus on technology although it also encompasses companies from other industries and from outside the US. The average annual return of the Nasdaq 100 has been 17.23% since 1986.
There are a number of ways to trade the Nasdaq 100. Most retail brokers and spread betting platforms offer bets using Contracts for Difference (CFD). For longer-term investors, Exchange-Traded Funds (ETFs) trade like shares that mimic the movement of the index without the investor needing to buy all 100 constituent companies. An example ETF is the Invesco QQQ Trust (QQQ). Nasdaq 100 futures contracts allow traders to speculate on the future direction of the index. Options provide the right, but not the obligation, to buy or sell the Nasdaq 100 at a specific price (strike price) in the future.
Many different factors drive the Nasdaq 100 but mainly it is the aggregate performance of the component companies revealed in their quarterly and annual company earnings reports. US and global macroeconomic data also contributes as it impacts on investor sentiment, which if positive drives gains. The level of interest rates, set by the Federal Reserve (Fed), also influences the Nasdaq 100 as it affects the cost of credit, on which many corporations are heavily reliant. As such the level of inflation can be a major driver too as well as other metrics which impact on the decisions of the Fed.
NASDAQ chart
The NASDAQ Composite is rebounding from the open, which is an extremely good sign for bulls. The primary goal at the momen will be the Fibonacci placeholder at the "1" level, which comes at 16,445. This is only about 1.5% higher than the current trading level, so it is quite achievable. Additionally, it comes in line with a region of resistance that lasted from March through May of this year.
If Monday's rebound drindles on Monday or Tuesday, then the market wil anticipate a further drop to the May 19 range low at 15,222.
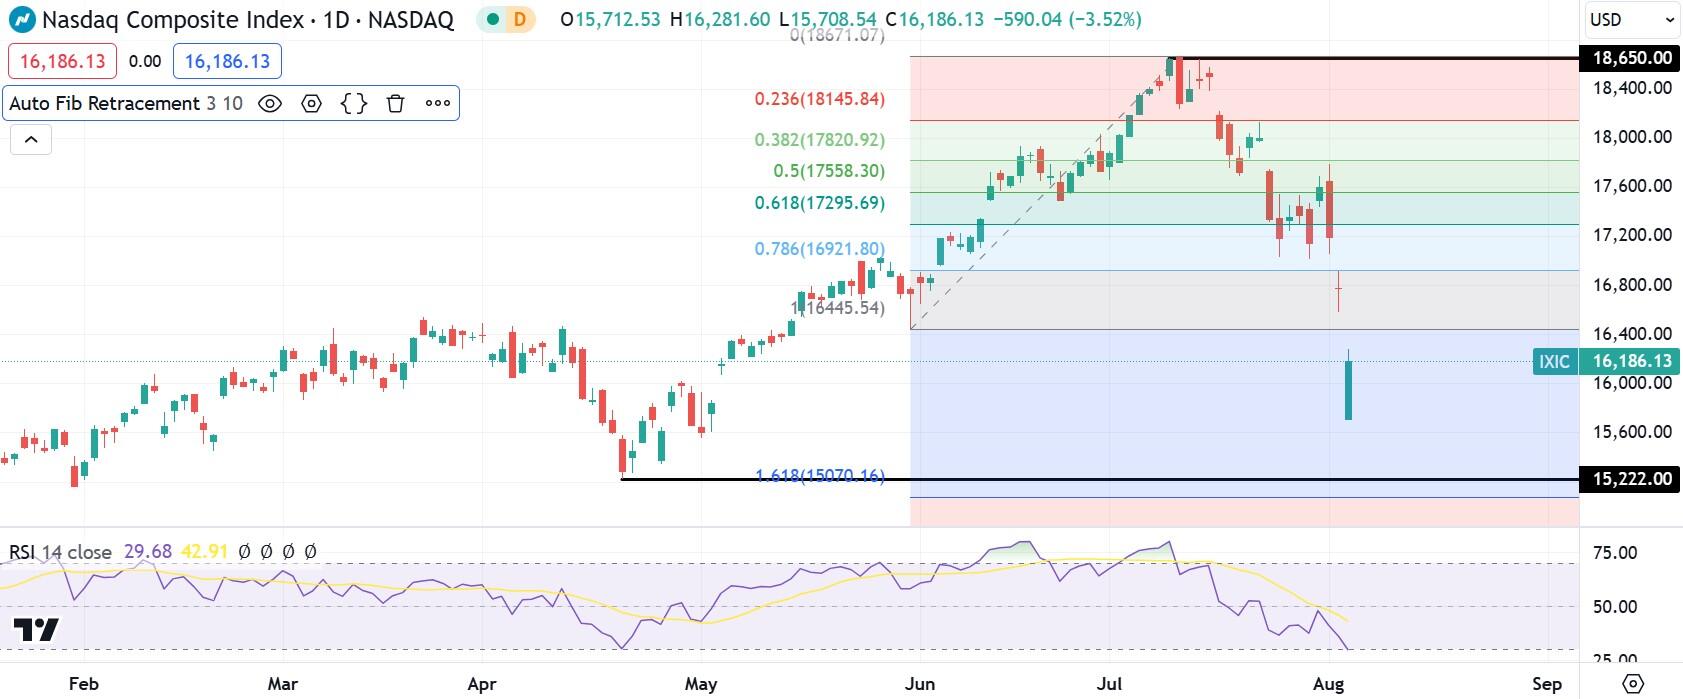
NASDAQ daily chart
Premium
You have reached your limit of 3 free articles for this month.
Start your subscription and get access to all our original articles.
Author

Clay Webster
FXStreet
Clay Webster grew up in the US outside Buffalo, New York and Lancaster, Pennsylvania. He began investing after college following the 2008 financial crisis.


