MicroStrategy Inc. (MSTR) Elliott Wave technical analysis [Video]
![MicroStrategy Inc. (MSTR) Elliott Wave technical analysis [Video]](https://editorial.fxstreet.com/images/Markets/Equities/DowJones/bloomberg-app-on-iphone-4-with-market-data-17118657_XtraLarge.jpg)
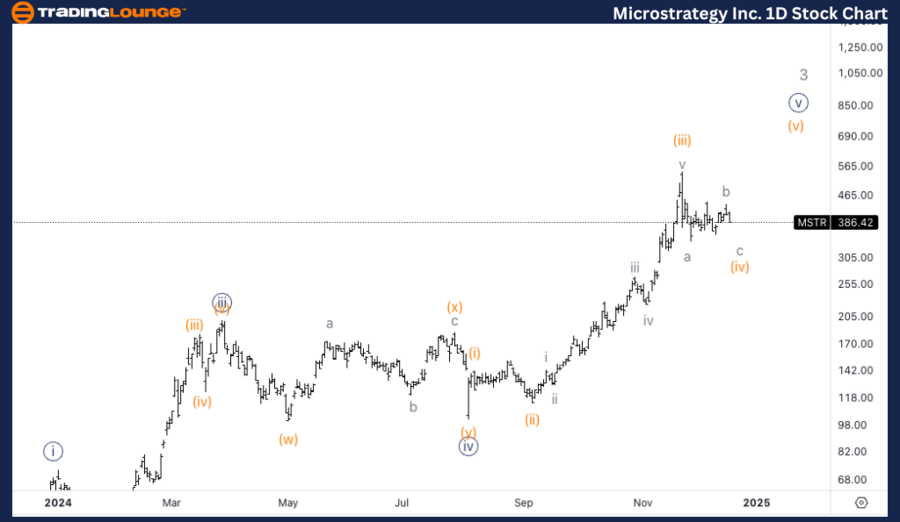
MSTR Elliott Wave Analysis Trading Lounge.
MicroStrategy Inc., (MSTR) daily chart.
MSTR Elliott Wave technical analysis
Function: Trend.
Mode: Impulsive.
Structure: Motive.
Position: Wave {v} of 3.
Direction: Pullback in (iv) of {v}.
Details: Looking for completion in wave (iv) to then continue higher and complete the five wave move into Minute wave {v} and back towards 500$.
MSTR Elliott Wave technical analysis – Daily chart
The daily chart suggests that wave (iv) of {v} is in progress. A corrective pullback is expected to complete wave (iv), after which the stock should resume its upward trajectory to complete Minute wave {v}, potentially targeting levels around $500. Once wave (iv) concludes, the final leg of the five-wave impulsive sequence will likely unfold.
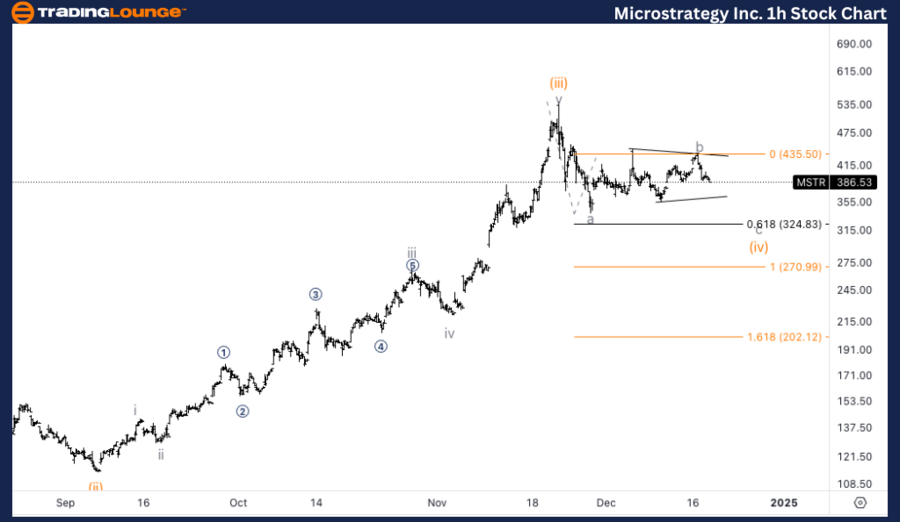
MSTR Elliott Wave technical analysis
Function: Trend.
Mode: Impulsive.
Strucutre: Motive.
Position: Wave (iv) of {v}.
Direction: Downside in wave c of (iv).
Details: Looking for completion in wave b which could turn out to be a triangle or else just a sideways correction, to then expect another leg lower in wave c towards 0.618 or equality of c vs. a at around 300$.
MSTR Elliott Wave technical analysis – One-hour chart
The 1-hour chart indicates that wave (iv) is still in progress, with wave b nearing completion. This could potentially form a triangle or a sideways correction. Once wave b completes, the expectation is for another leg lower in wave c, targeting around the 0.618 Fibonacci retracement or equality of wave c vs. wave a near $300. This final leg down would complete the corrective phase before the next upward move in wave {v} begins.
This analysis focuses on the current trend structure of MicroStrategy Inc., (MSTR) utilizing the Elliott Wave Theory on both the daily and 1-hour charts. Below is a breakdown of the stock's position and potential future movements.
MicroStrategy Inc. (MSTR) Elliott Wave technical analysis
Author

Peter Mathers
TradingLounge
Peter Mathers started actively trading in 1982. He began his career at Hoei and Shoin, a Japanese futures trading company.


