|

Microsoft poised for gains: Elliott Wave analysis signals the next leg up [Video]

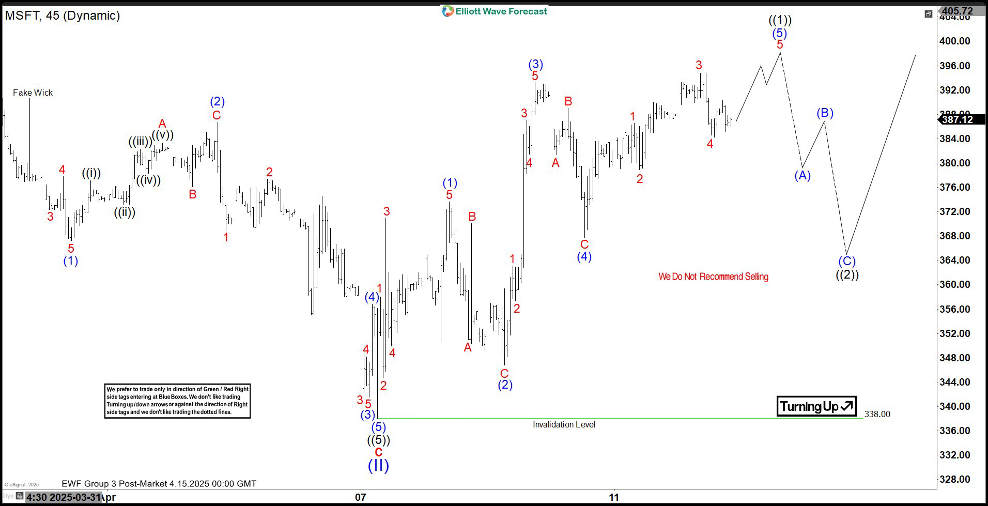
The short-term Elliott Wave outlook for Microsoft (MSFT) paints a bullish picture, suggesting the stock has room to climb after a key low at $338 on April 7, 2025. This level marked the end of a corrective phase, known as wave (II), following a decline that began on July 5, 2024. That selloff unfolded in a three-wave pattern, a hallmark of a correction rather than a bearish trend. Notably, the final leg of this decline, starting from the December 12, 2024 high, didn’t reach a typical Fibonacci extension (1.618), reinforcing the idea that the market remains bullish on Microsoft.

Since hitting the $338 low, Microsoft has rallied in a five-swing pattern, a structure called a motive sequence, signaling potential for further gains. The rally’s first leg, wave (1), peaked at $373.65, followed by a dip to $346.75 in wave (2). The stock then surged to $393.23 in wave (3), with a brief pullback to $367.80 in wave (4). Now, Microsoft is likely nearing the end of wave (5), completing a larger wave ((1)).

Looking ahead, a wave ((2)) pullback is expected to correct the rally from April 7, but as long as the $338 low holds, any dips should find support in a three-, seven-, or eleven-swing pattern, setting the stage for more upside. This suggests short-term pauses but a continued upward trend for Microsoft, making it a stock to watch for bullish opportunities.

Microsoft 45 minute Elliott Wave chart

Microsoft Elliott Wave [Video]

Author

Elliott Wave Forecast Team

Elliott Wave Forecast Team

ElliottWave-Forecast.com

More from Elliott Wave Forecast Team
Share:

Editor's Picks

EUR/USD looks apathetic around 1.1770

EUR/USD comes under renewed pressure on Tuesday, deflating below the 1.1800 support and reversing two consecutive days of gains. The pair’s decline follows the persistent move higher in the US Dollar, as trade uncertainty dominates the sentiment ahead of President Trump’s SOTU speech.

GBP/USD regains 1.3500 and above

GBP/USD extends its advance for the third day in a row on Tuesday, this time retesting the area beyond the 1.3500 hurdle. Cable’s uptick comes despite decent gains in the Greenback and the dovish message from the BoE’s Bailey at the UK Parliament.

Gold appears offered around $5,150

Gold is giving back a good portion of the recent multi-day rally, receding to the $5,150 zone per troy ounce amid the decent bounce in the US Dollar and mixed US Treasuty yields. In the meantime, markets’ attention remain on upcoming comments from Fed speakers.

Ripple’s DeFi shift in focus: Navigating XRPL EVM sidechain growth, XRPFi migration and liquidity

Ripple (XRP) has continued to trade under pressure, extending its decline by approximately 63% from the record high of $3.66 in July. The remittance token is trading above support at $1.35, while its upside appears limited by key supply zones, starting with $1.40, at the time of writing on Tuesday.

The Citrini report: How a debatable AI narrative can shake Wall Street

That AI-related headline alone was enough to rattle investors.US stocks slid sharply on Monday after a widely circulated Citrini Research memo outlined a hypothetical “2028 Global Intelligence Crisis”, warning that rapid AI adoption could push US unemployment into double digits as early as by mid-2028.

XRP pressured by weak ETF flows and declining retail interest

Ripple (XRP) is edging lower, trading above its intraday low of $1.32 at the time of writing on Tuesday. The decline from its weekly opening of $1.39 reflects heightened volatility in the broader cryptocurrency market, accentuated by tariff-triggered uncertainty.