Meta Platforms Inc.(META) Elliott Wave technical analysis [Video]
![Meta Platforms Inc.(META) Elliott Wave technical analysis [Video]](https://editorial.fxstreet.com/images/TechnicalAnalysis/ChartPatterns/Candlesticks/high-resolution-stock-exchange-evolution-panel-55741904_XtraLarge.jpg)
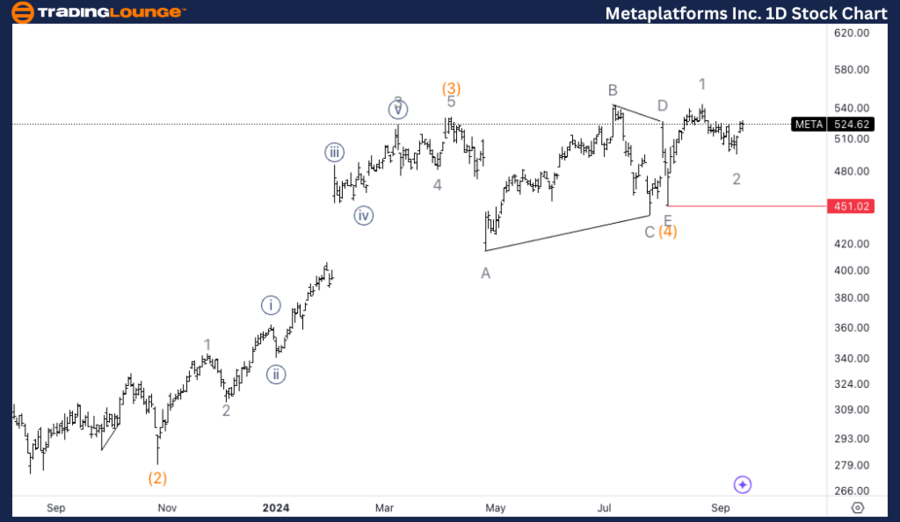
Meta Platforms Inc., (META) Daily Chart
META Elliott Wave technical analysis
Function: Trend.
Mode: Impulsive.
Structure: Motive.
Position: Intermediate wave (5).
Direction: Upside in wave 3.
Details: Looking for a bottom in wave 2 in place as we bounced off 500$, looking for upside towards Medium Level at 650$.
META Elliott Wave technical analysis – Daily chart
On the daily chart, META is advancing in Intermediate wave (5), which appears to have just completed a wave 2 correction. After bouncing off the key 500$ support level, the stock is now gearing up for a move higher. The next target on this upward trajectory is MediumLevel at 650$, which would mark a significant resistance level as the stock progresses within wave 3. The establishment of support at 500$ strengthens the bullish case and suggests that the uptrend remains intact.
META Elliott Wave technical analysis
Function: Trend.
Mode: Impulsive.
Structure: Motive.
Position: Minute wave {i}.
Direction: Upside in wave {i}.
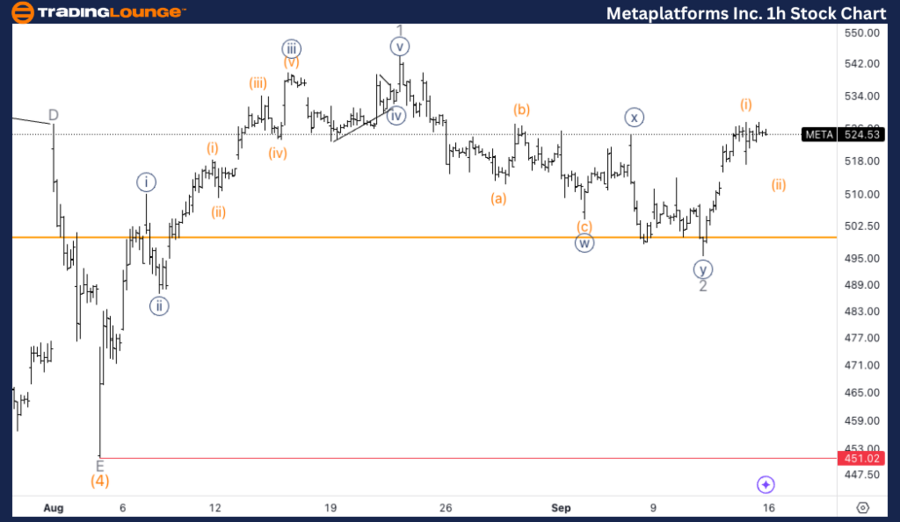
Details: Looking for a potential top in wave (i) of {i} as we have broken previous wave {b}. Looking for a three wave pullback.
META Elliott Wave technical analysis – One-hour chart
The 1-hour chart indicates that META is in Minute wave {i} of the larger wave structure. After breaking the previous wave {b} high, the stock is showing signs of nearing the top of wave (i) of {i}. Traders should now be on the lookout for a potential three-wave pullback in wave (ii), which would serve as a correction before the next upward move. This pullback could provide a buying opportunity for those looking to position for further upside.
Meta Platforms Inc. (META) is currently exhibiting strong bullish momentum, as seen through the Elliott Wave analysis. With the stock recovering from recent lows and showing signs of further upward movement, traders are eyeing potential targets for the next major rally. In this analysis, we break down META’s wave structure on both the daily and 1-hour charts, highlighting key support and resistance levels along with actionable insights for traders.
Meta Platforms Inc.(META) Elliott Wave technical analysis [Video]
Author

Peter Mathers
TradingLounge
Peter Mathers started actively trading in 1982. He began his career at Hoei and Shoin, a Japanese futures trading company.


