Meta Platforms Inc. (META) Elliott Wave technical analysis [Video]
![Meta Platforms Inc. (META) Elliott Wave technical analysis [Video]](https://editorial.fxstreet.com/images/TechnicalAnalysis/ChartPatterns/Chartism/stock-market-chart-with-pen-23290418_XtraLarge.jpg)
META Elliott Wave technical analysis
Function: Trend.
Mode: Impulsive.
Structure: Motive.
Position: Intermediate wave (5).
Direction: Upside in wave (5).
Details: We are looking at a potential wave 1-2 in the making. We seem to be close to a bottom in wave 2 of (5), as we are now trading above TRadingLevel5 at 500$.
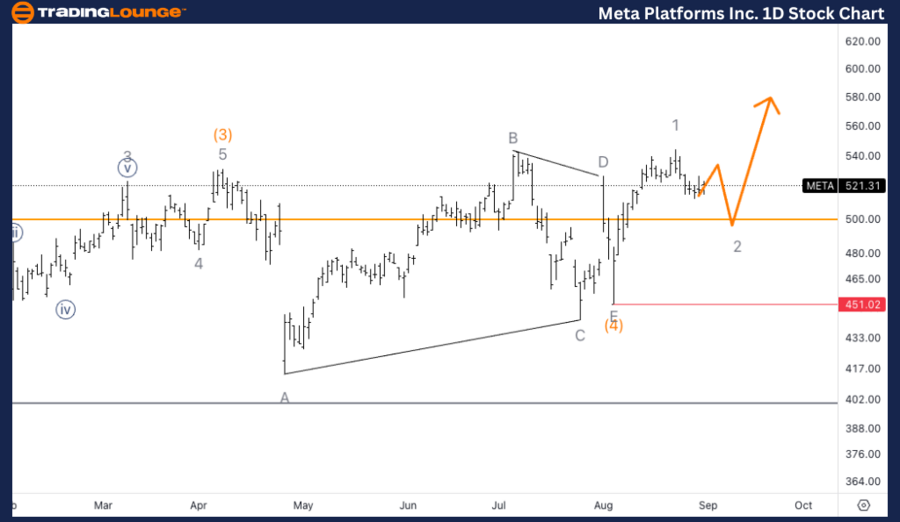
META Elliott Wave technical analysis – Daily chart
META is potentially forming a wave 1-2 within the larger Intermediate wave (5). The price action suggests that wave 2 might be nearing its completion as the stock is trading above the critical TradingLevel5 (500$). This area could act as a support zone, signaling the potential start of wave 3 of (5), which would indicate a strong upward move if confirmed.
META Elliott Wave technical analysis
Function: Trend
Mode: Impulsive
Structure: Motive
Position: Minor wave 2.
Direction: Bottom in wave 2.
Details: Here we take a look at the possibility wave 2 is in place and we are resuming higher. We seem to be finding support on top of 520$ which is a bullish sign. If we manage to get a ClassicTradingLevel on top of 530$, we can then look for further upside.
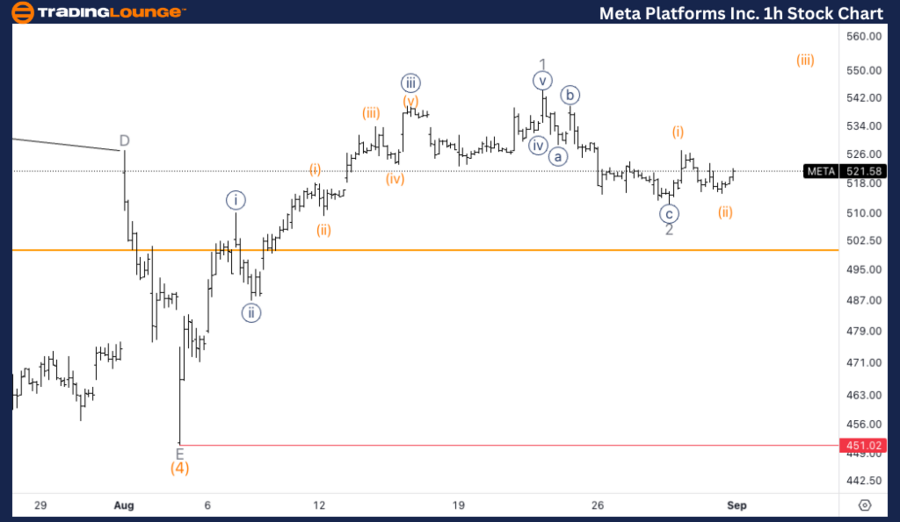
META Elliott Wave technical analysis – One-hour chart
The 1-hour chart analysis suggests that wave 2 may have found support around the 520$ level, which aligns with the bullish outlook. The price action above 520$ and the potential establishment of a Classic TradingLevel on top of 530$ would reinforce the bullish case, setting the stage for a resumption of the uptrend in wave 3. This scenario would likely lead to further upside, with targets extending significantly higher.
This Elliott Wave analysis for Meta Platforms Inc. (META) as of September 2, 2024, provides insights into the stock's trend direction and potential price movements on both the daily and 1-hour charts. The analysis helps traders understand the market structure and potential trading opportunities.
Meta Platforms Inc. (META) Elliott Wave technical analysis [Video]
Author

Peter Mathers
TradingLounge
Peter Mathers started actively trading in 1982. He began his career at Hoei and Shoin, a Japanese futures trading company.


