Meta Platforms Inc.(META) Elliott Wave technical analysis [Video]
![Meta Platforms Inc.(META) Elliott Wave technical analysis [Video]](https://editorial.fxstreet.com/images/TechnicalAnalysis/ChartPatterns/Chartism/generic-chart-19151967_XtraLarge.jpg)
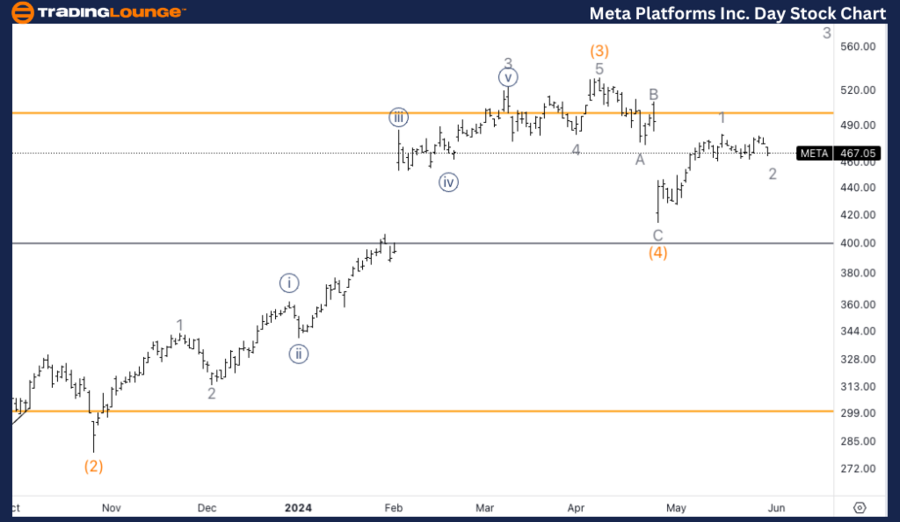
Meta Platforms Inc., (META) daily chart
META Elliott Wave technical analysis
Function: Trend.
Mode: Impulsive.
Structure: Motive.
Position: Minor 2.
Direction: Upside in 3 of (5).
Details: Looking for a bottom in place in wave (4), looking to start trading above TL5 at 500$.
META Elliott Wave technical analysis – Daily chart
In our Elliott Wave analysis of Meta Platforms Inc. (META). we observe an impulsive trend characterized by a motive structure. META is currently positioned in Minor wave 2, indicating an upside movement in wave 3 of (5). We are looking for a bottom to be in place in wave (4) and anticipate trading above TL5 at $500. Traders should monitor this level for confirmation of the upward trend resumption.
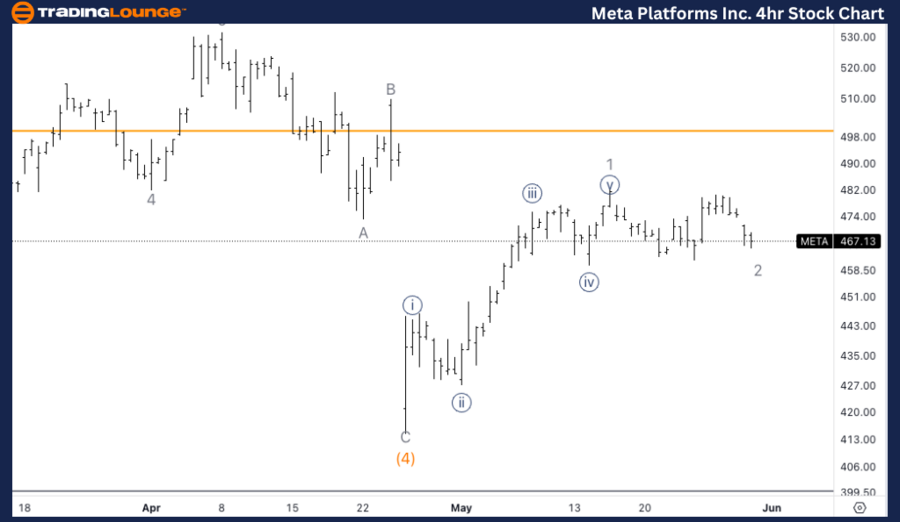
META Elliott Wave technical analysis – Four-hour chart
On the 4-hour chart, META is following an impulsive trend within a motive structure, specifically in wave {c} of 2. The analysis reveals five waves to the upside into wave 1, followed by a three-wave corrective move in wave 2. As we enter a demand zone, we are looking for a bullish turn soon, indicating the start of wave 3. This phase provides a strategic entry point for long positions, aligning with the overall bullish outlook.
Function: Trend.
Mode: Impulsive.
Structure: Motive.
Position: Wave {c} of 2.
Direction: Upside in 3.
Details: We can identify five waves to the upside into wave 1 and a three wave move in wave 2. Looking for a turn soon as we are entering a zone of demand.
Meta Platforms Inc.(META) Elliott Wave technical analysis [Video]
Author

Peter Mathers
TradingLounge
Peter Mathers started actively trading in 1982. He began his career at Hoei and Shoin, a Japanese futures trading company.


